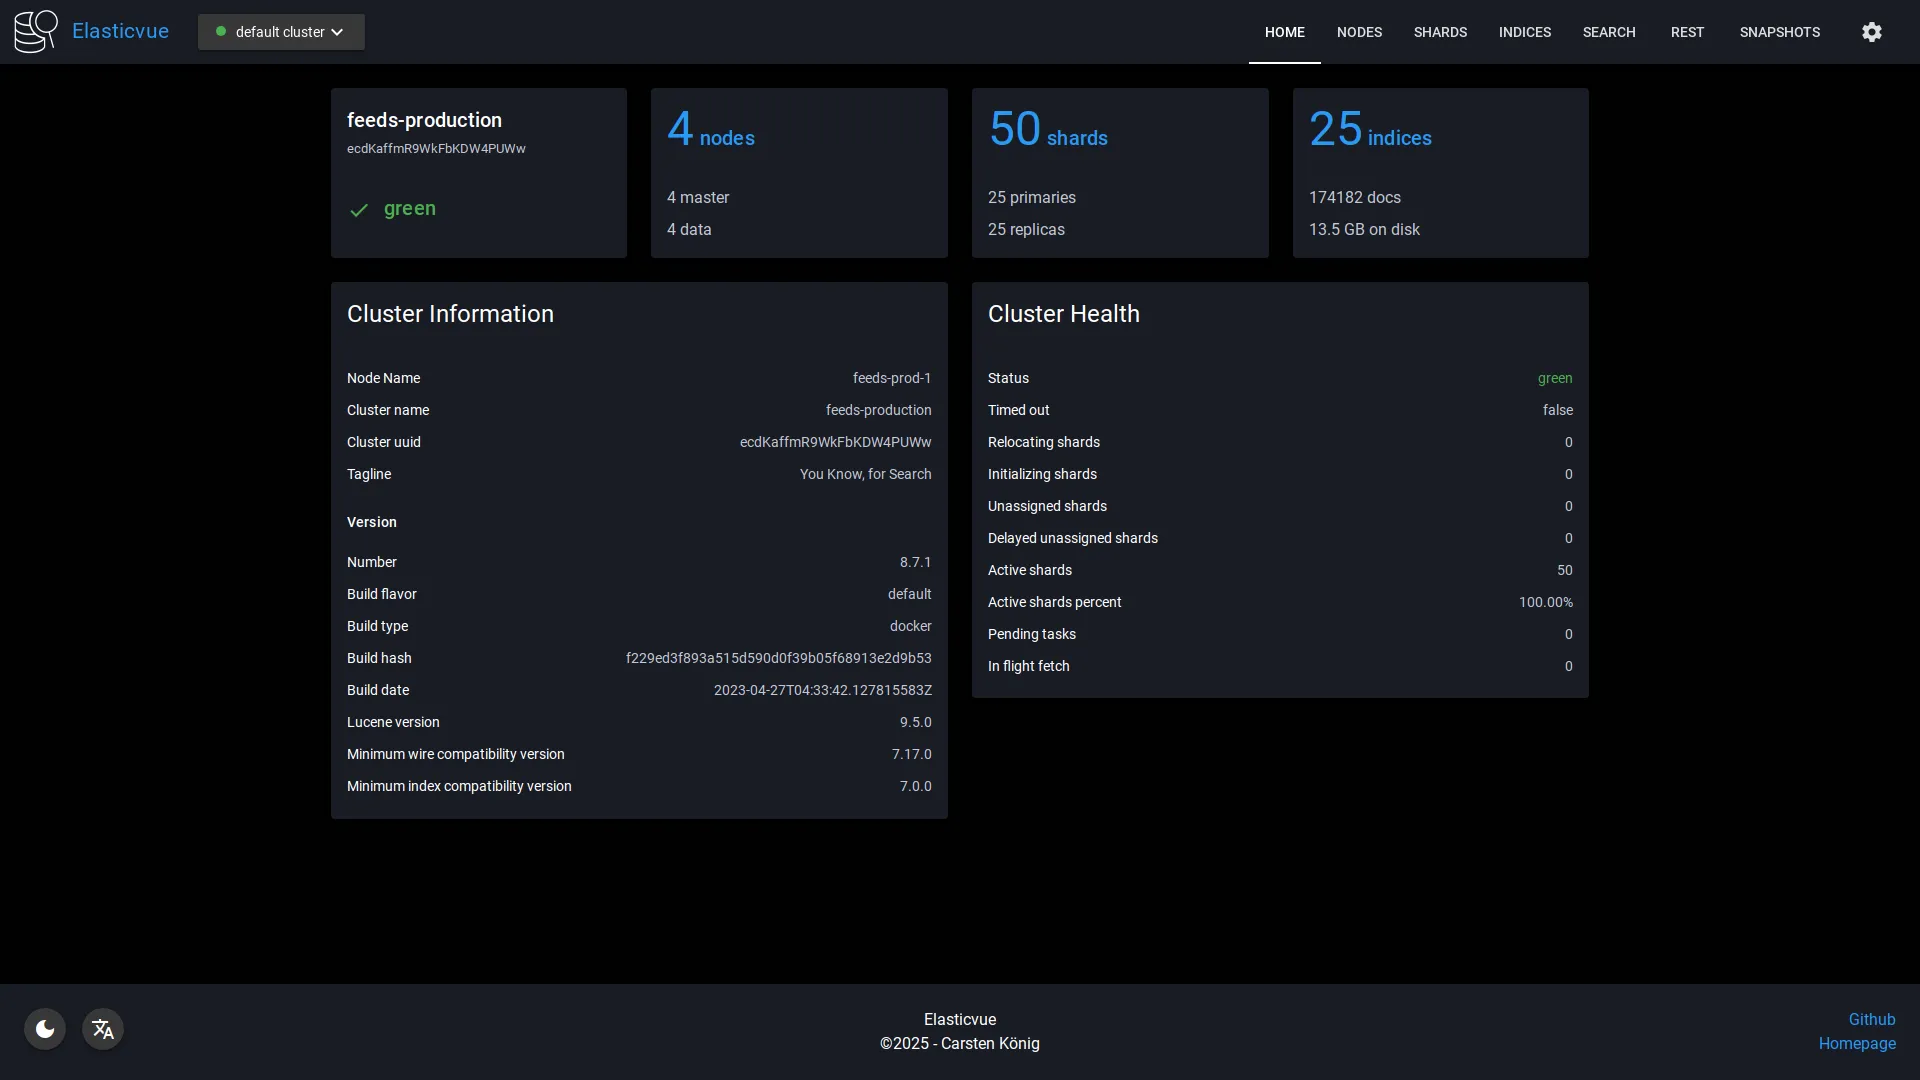
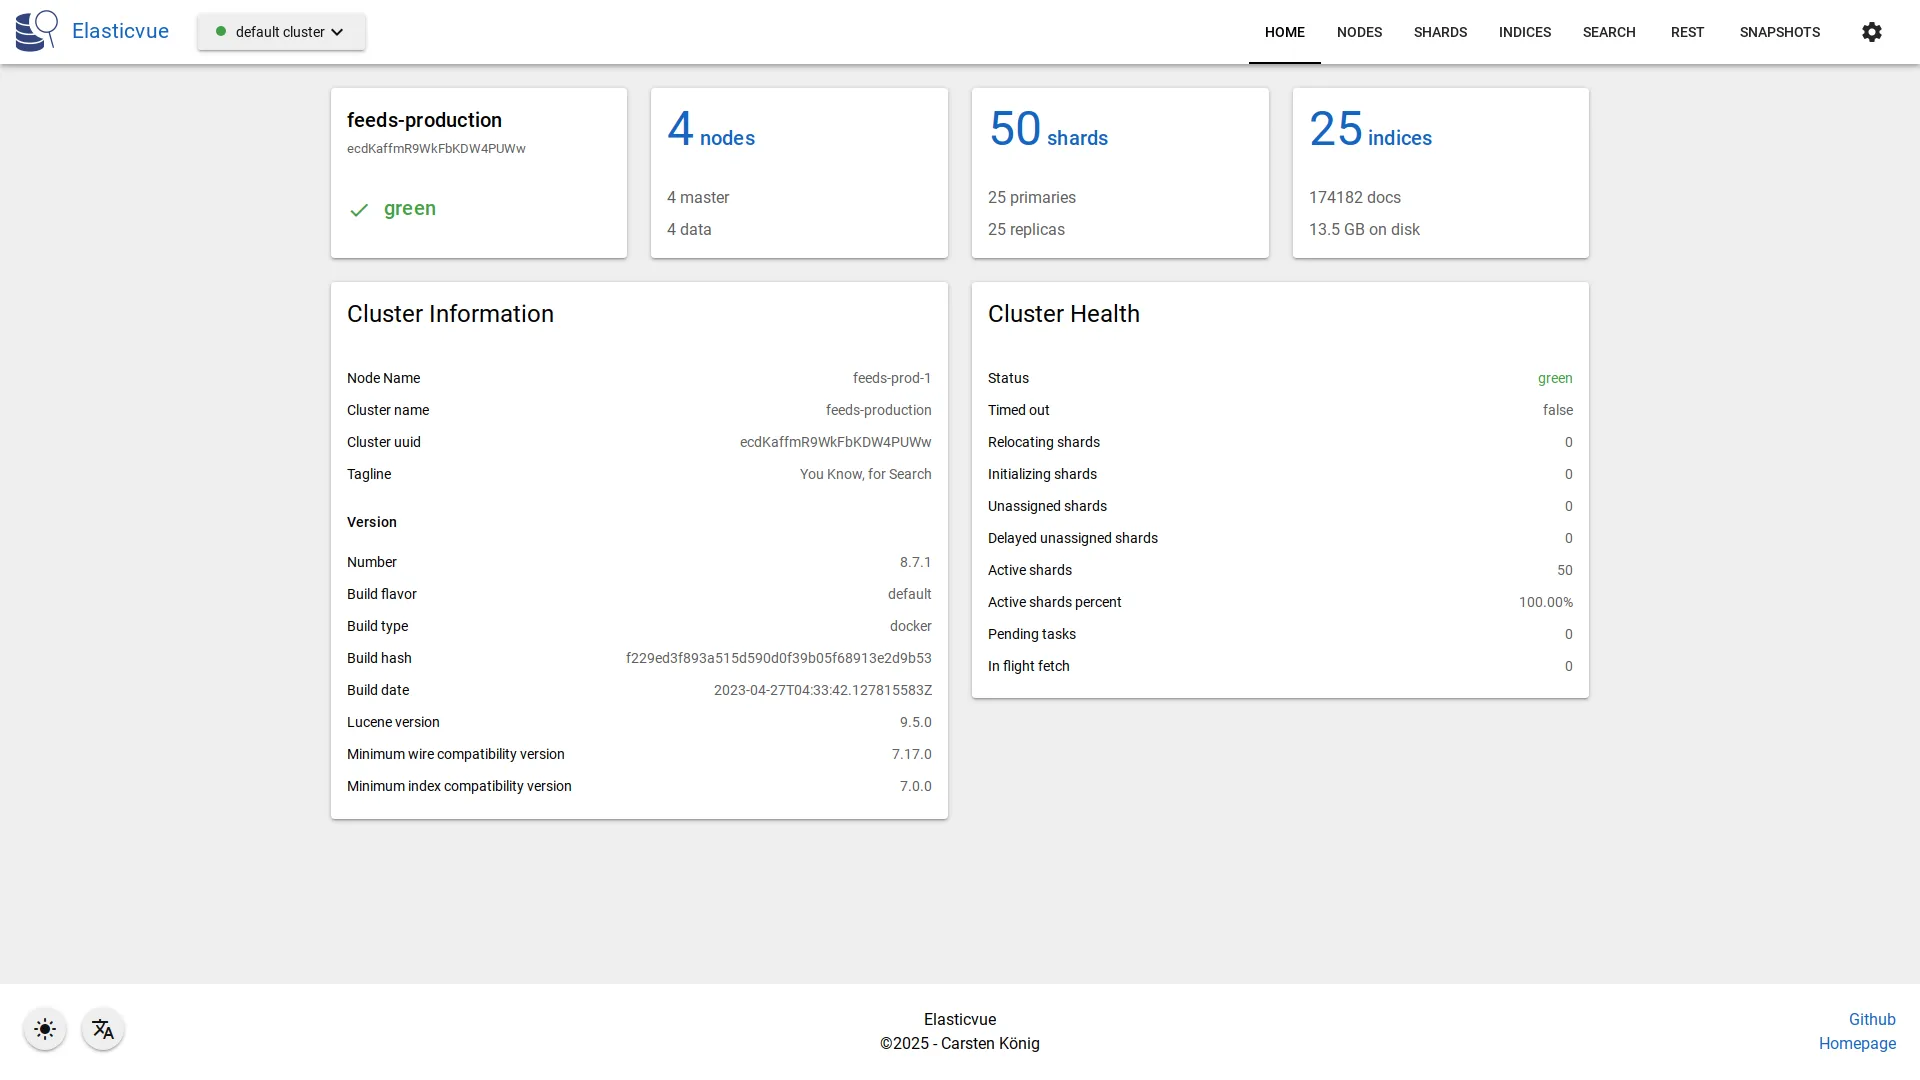
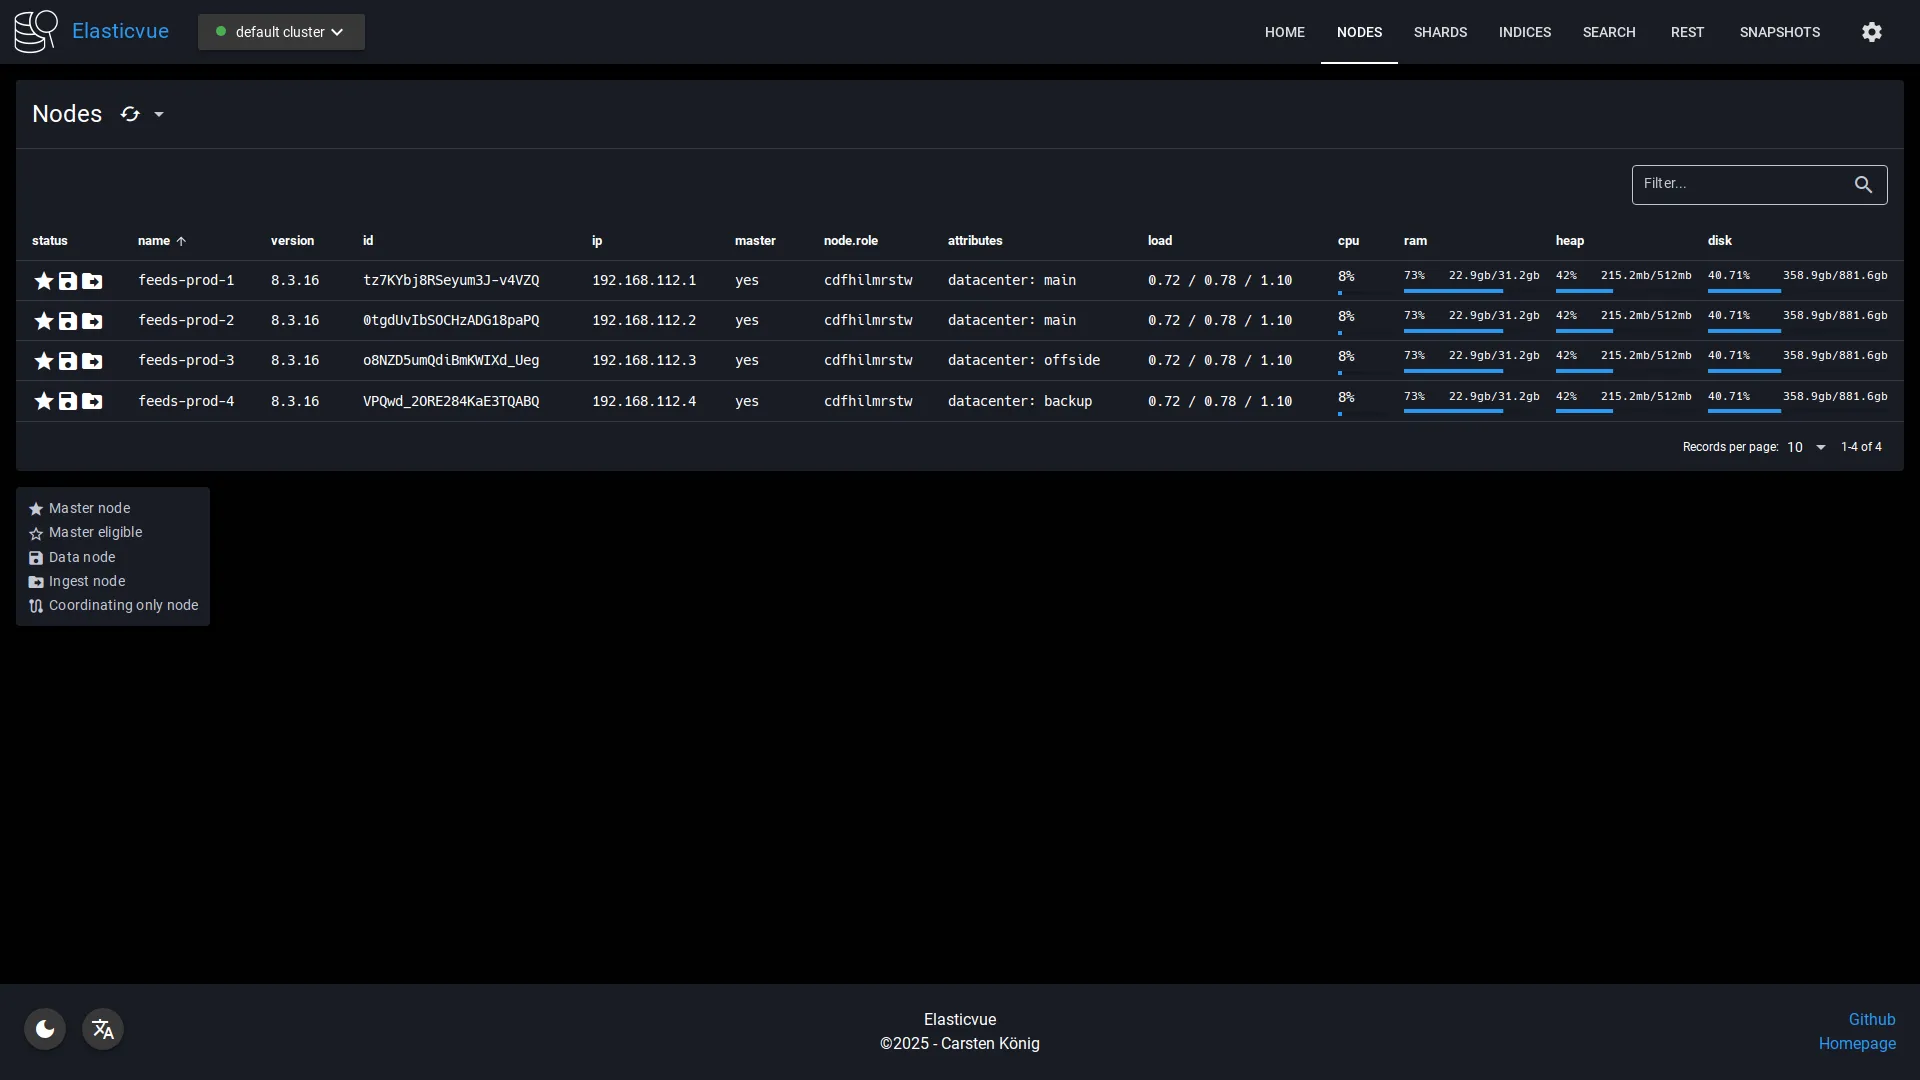
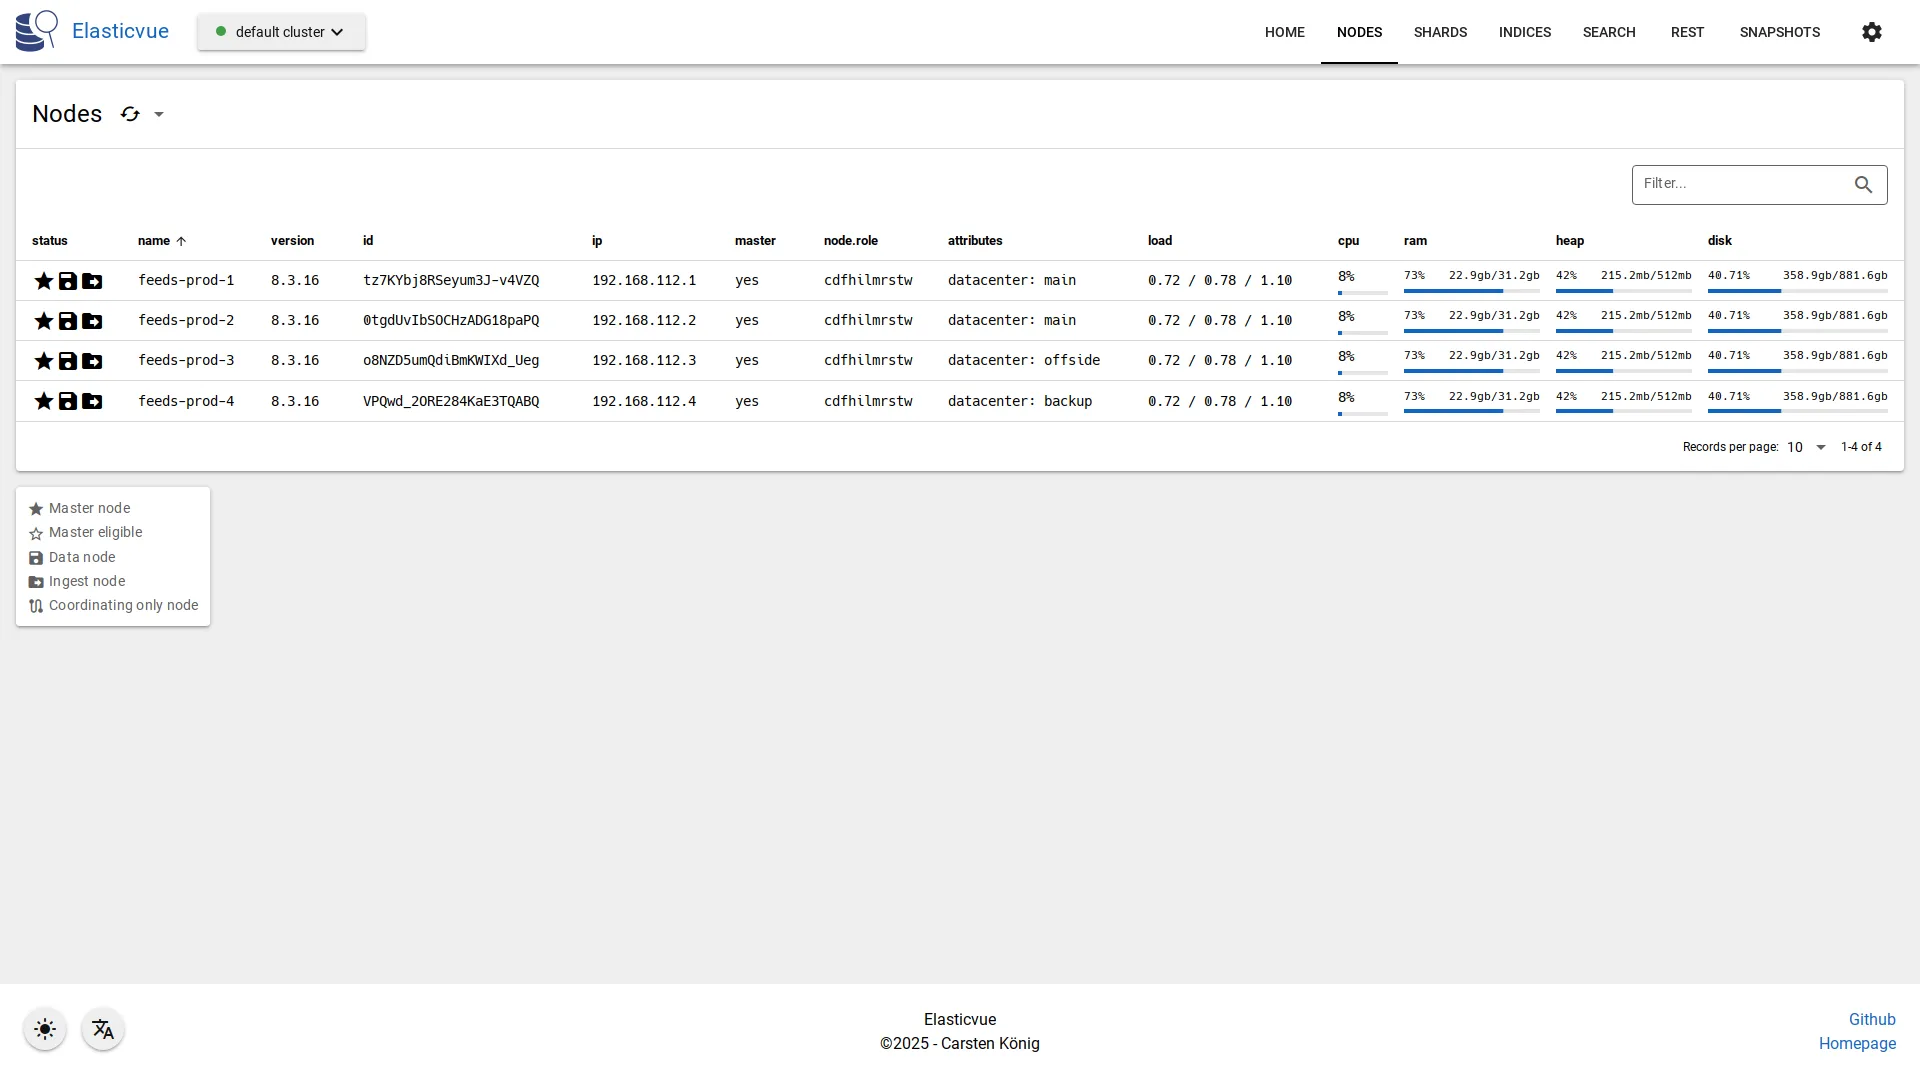
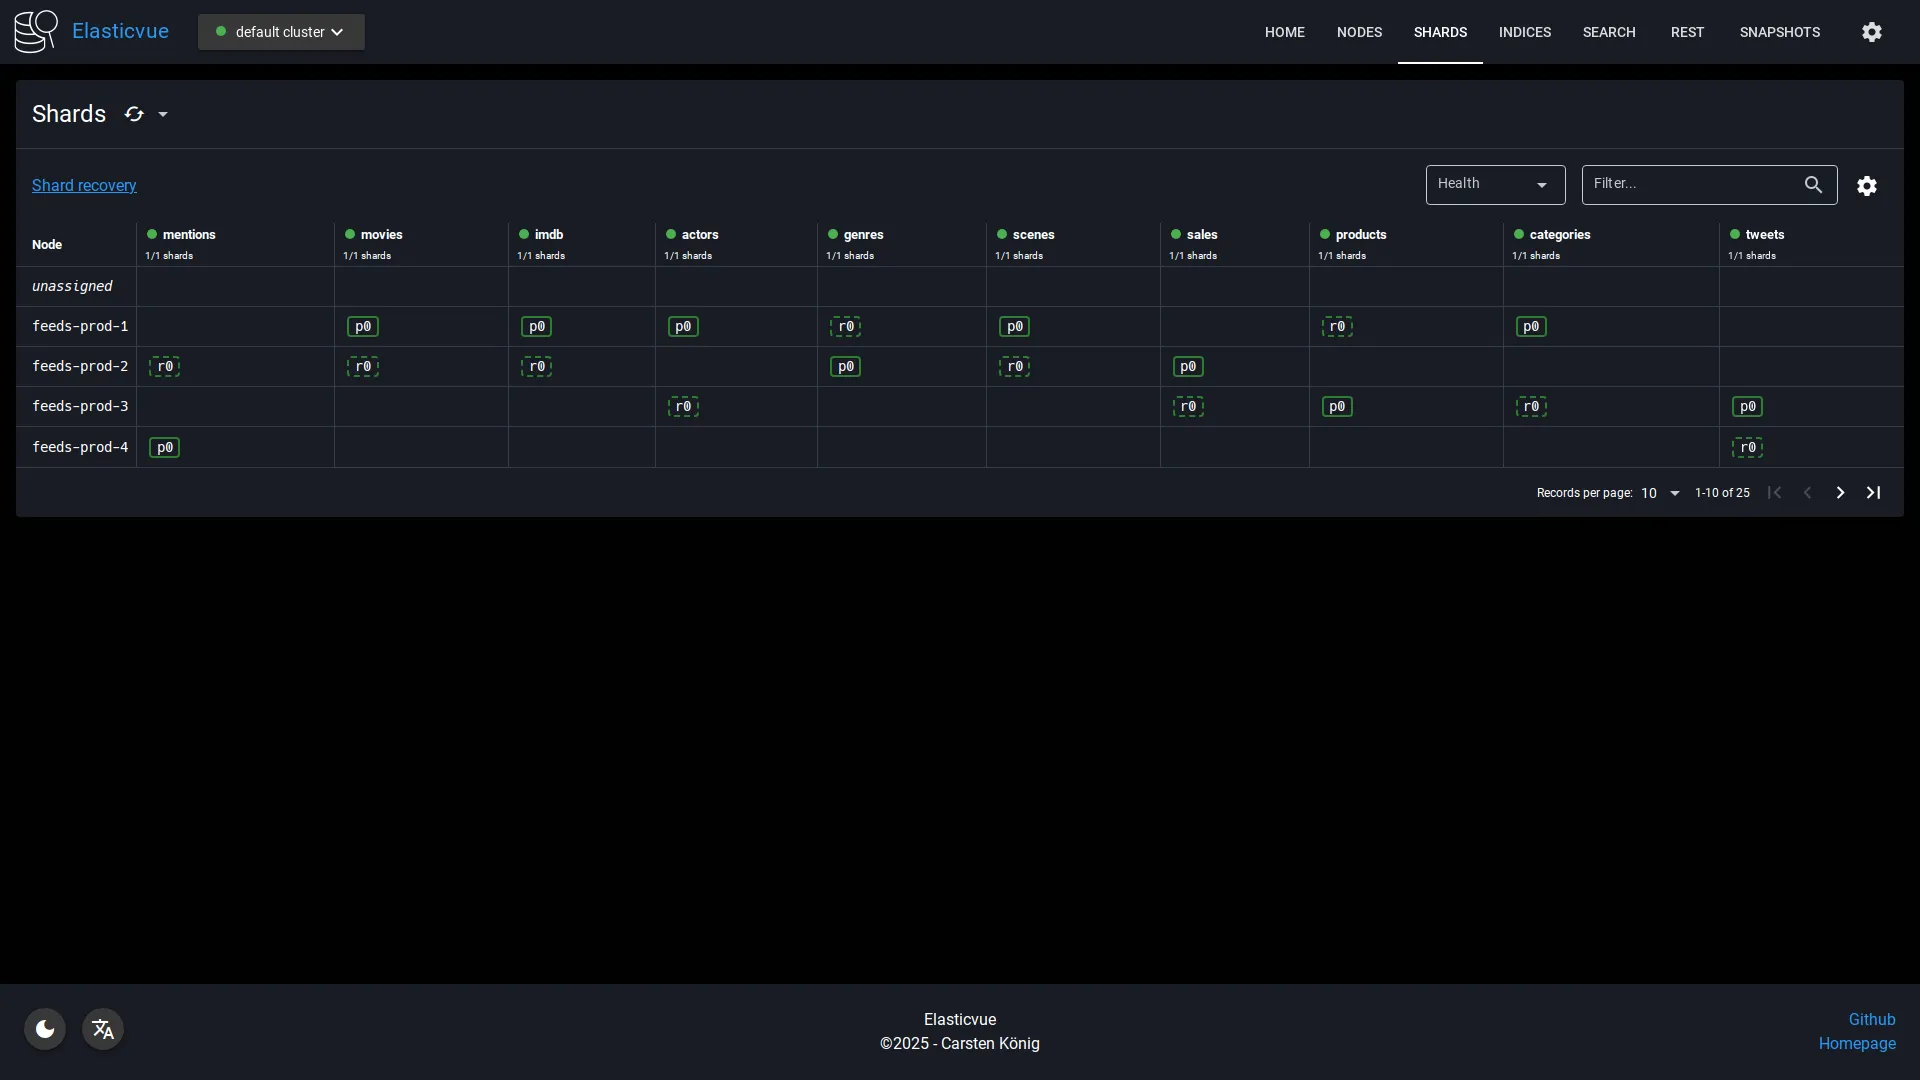
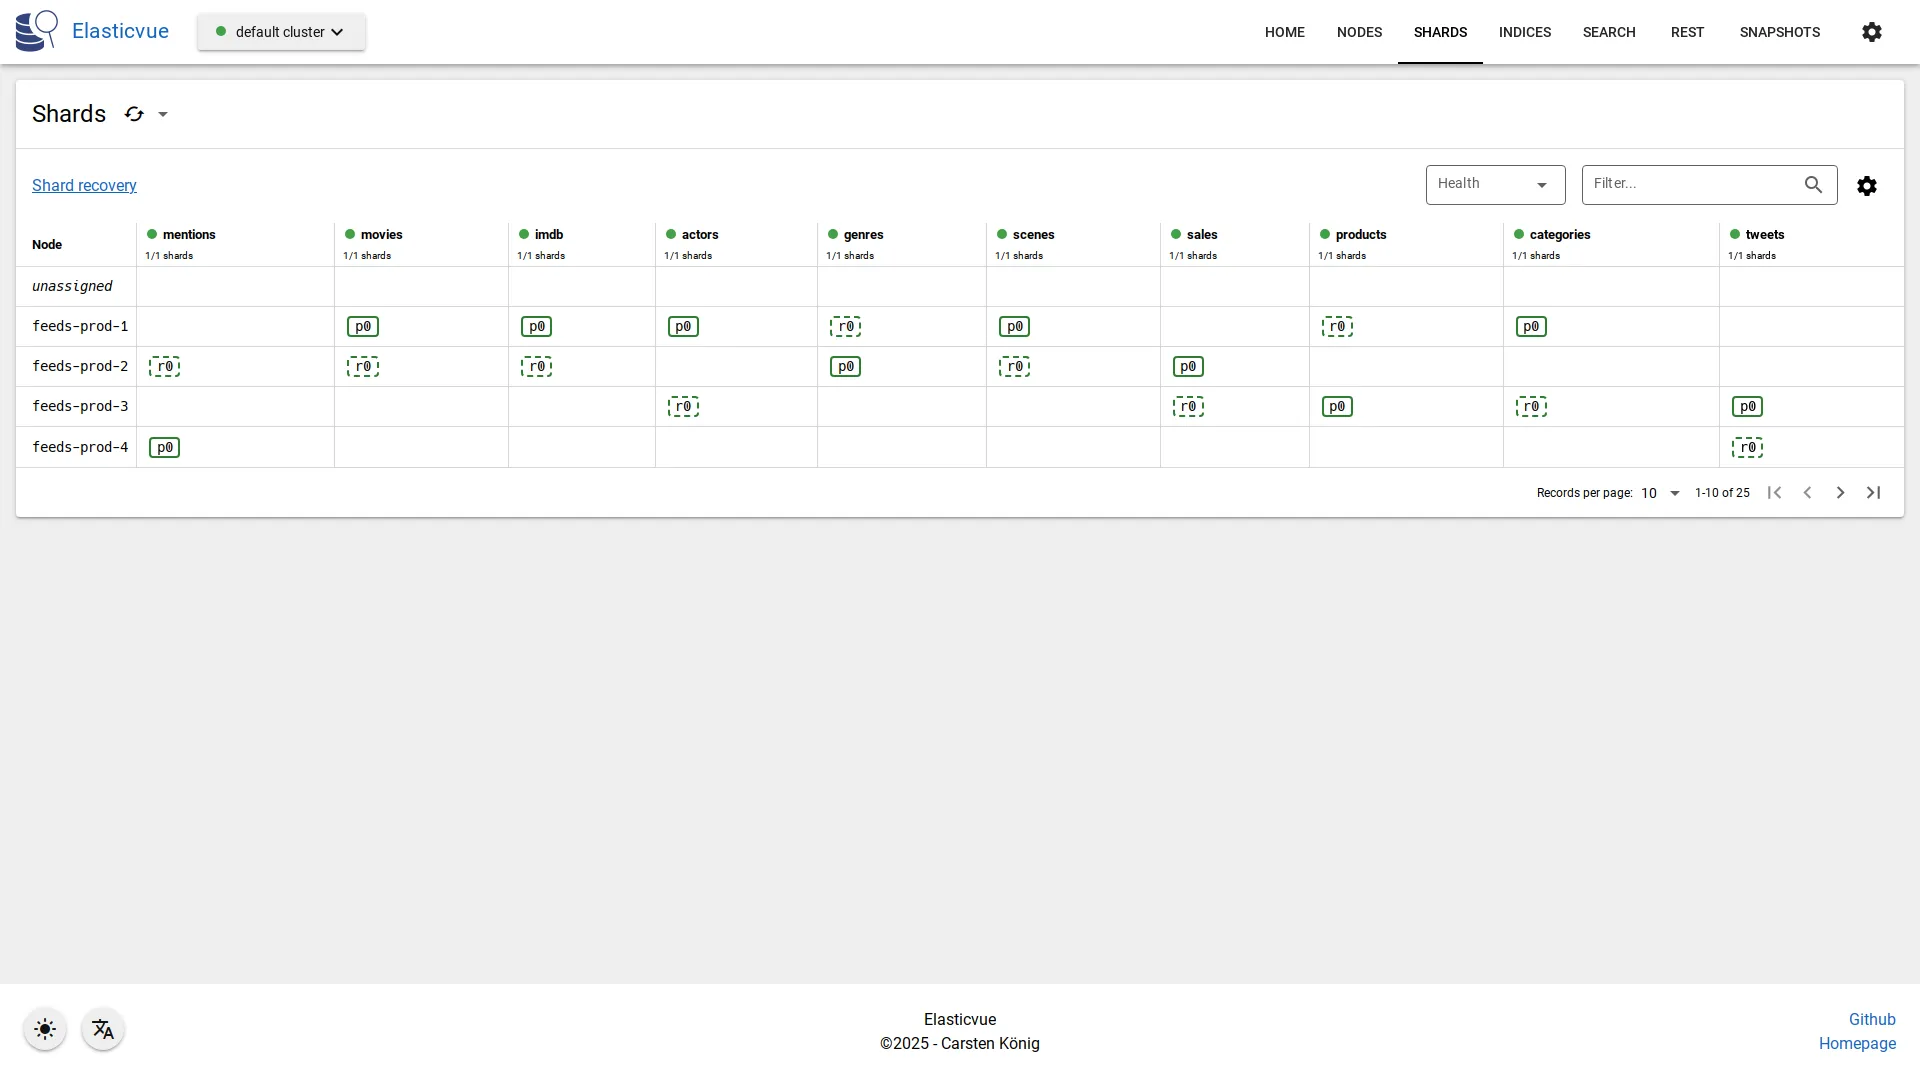
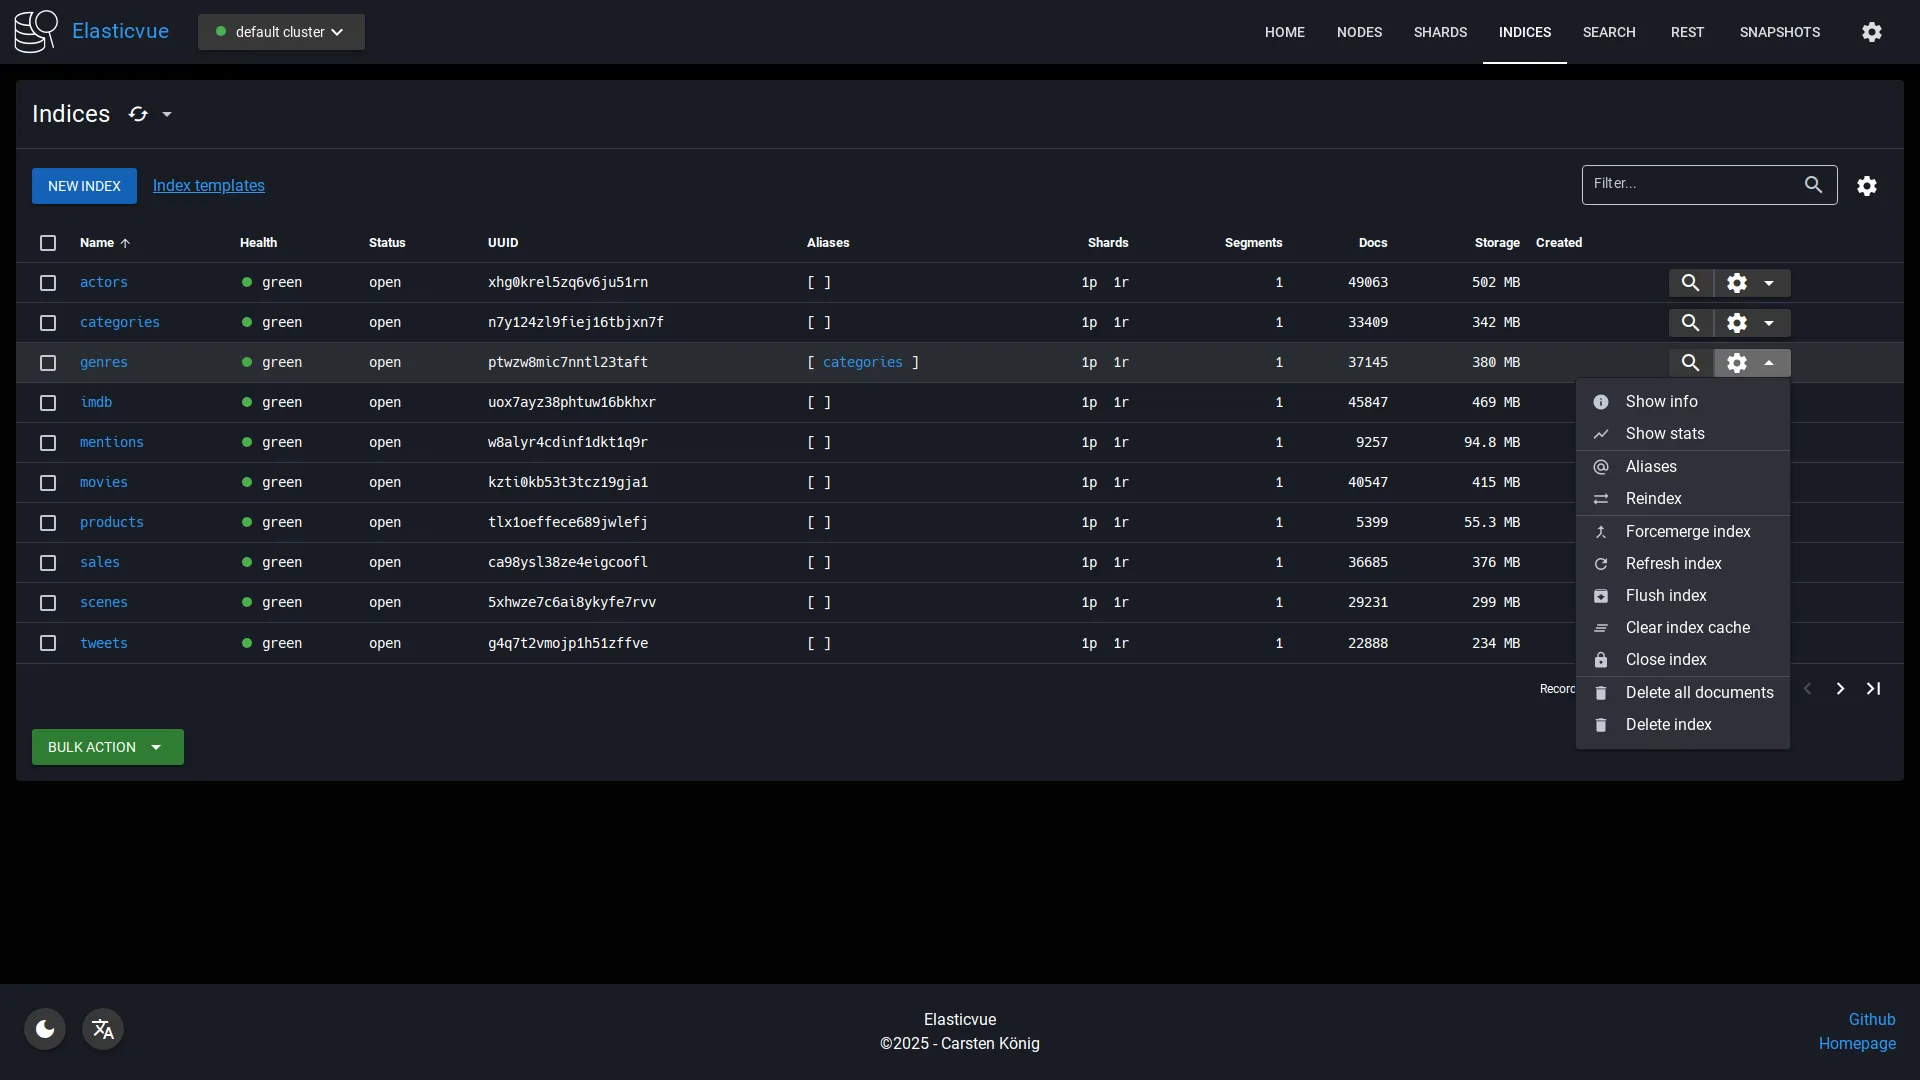
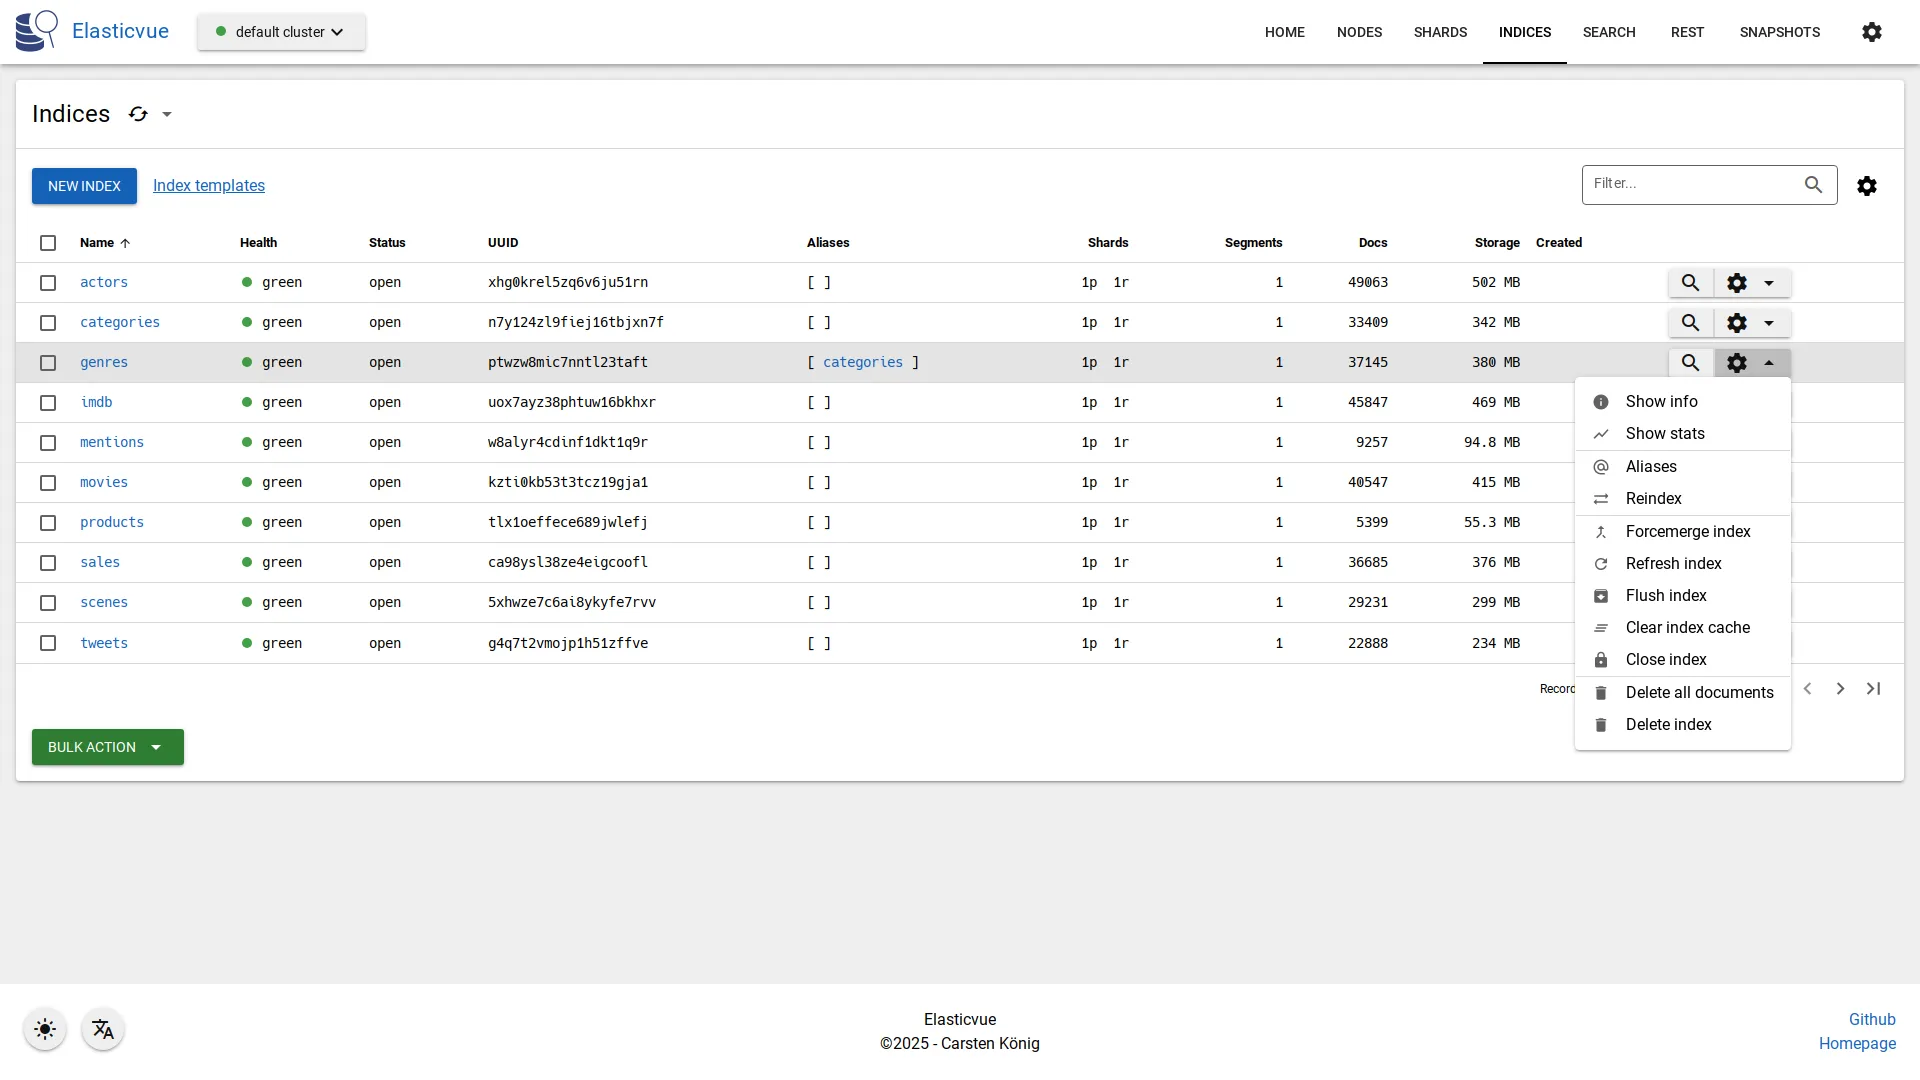
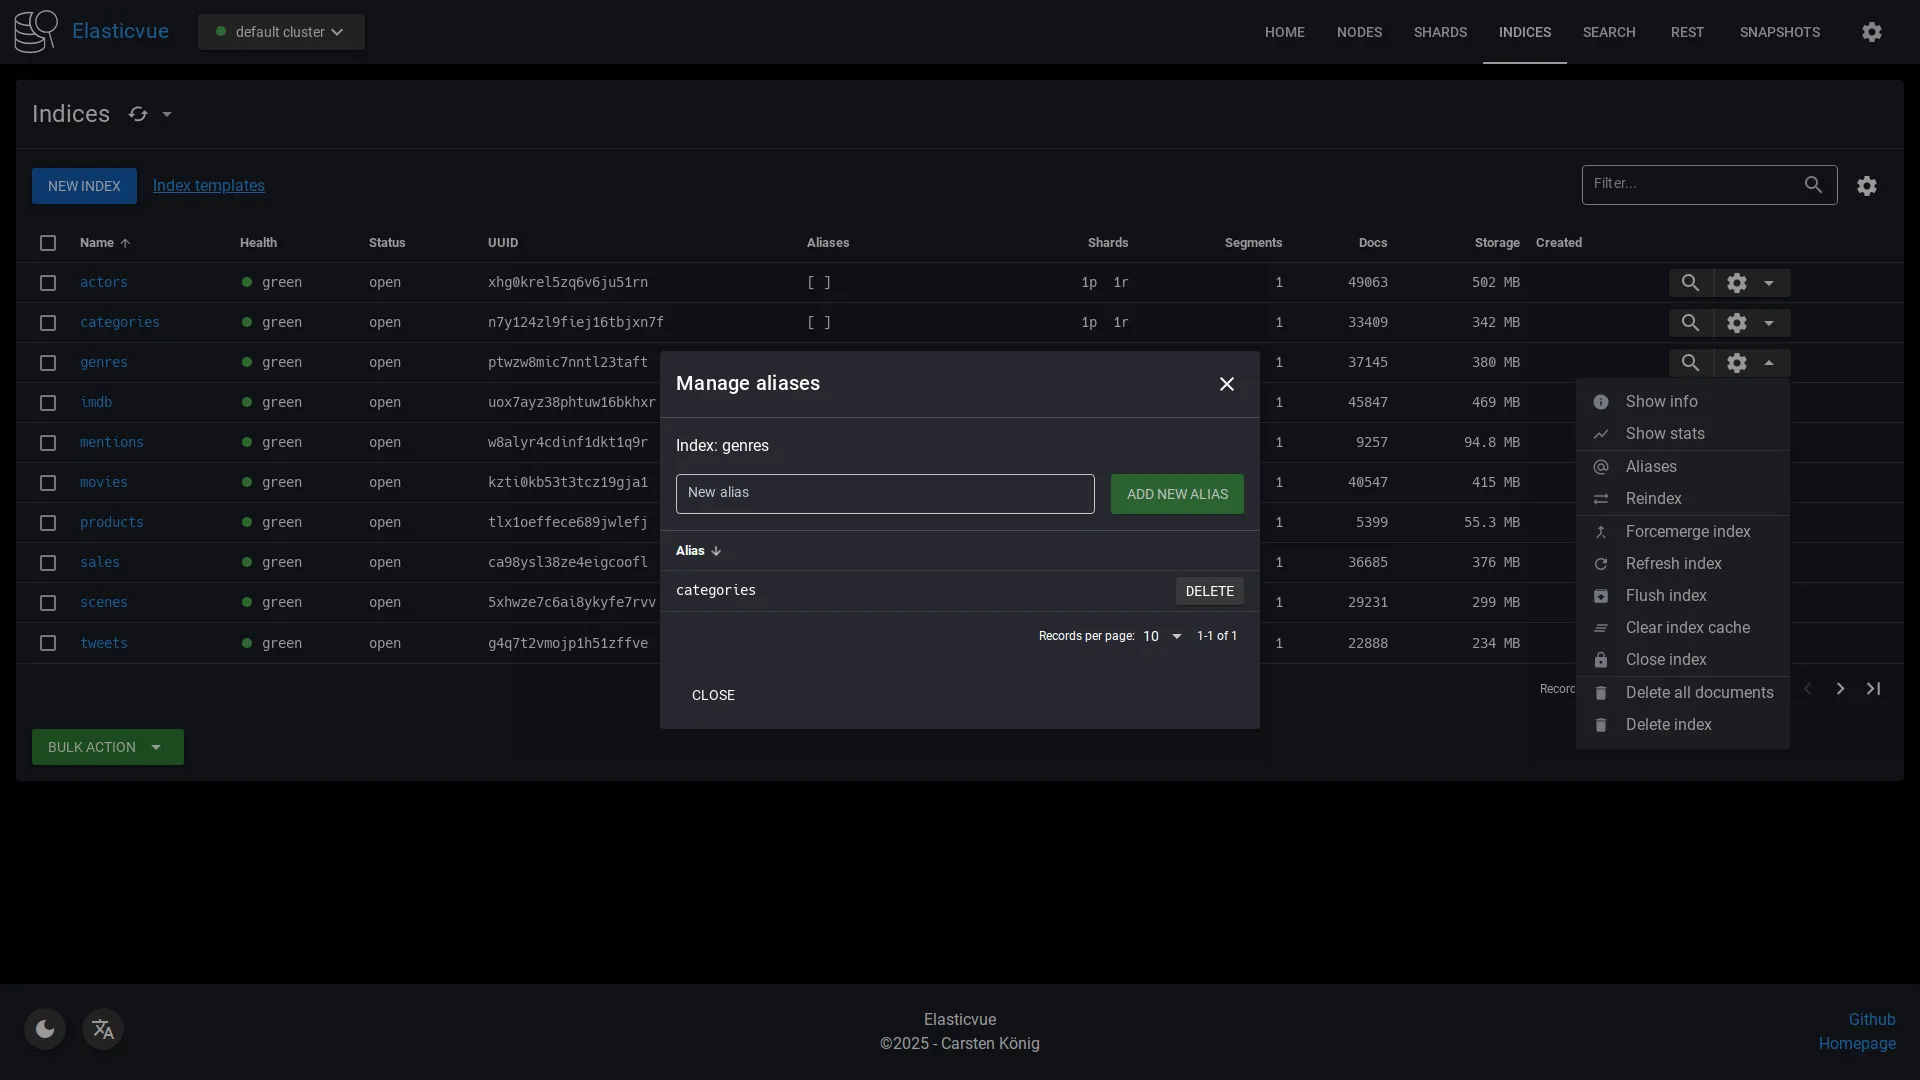
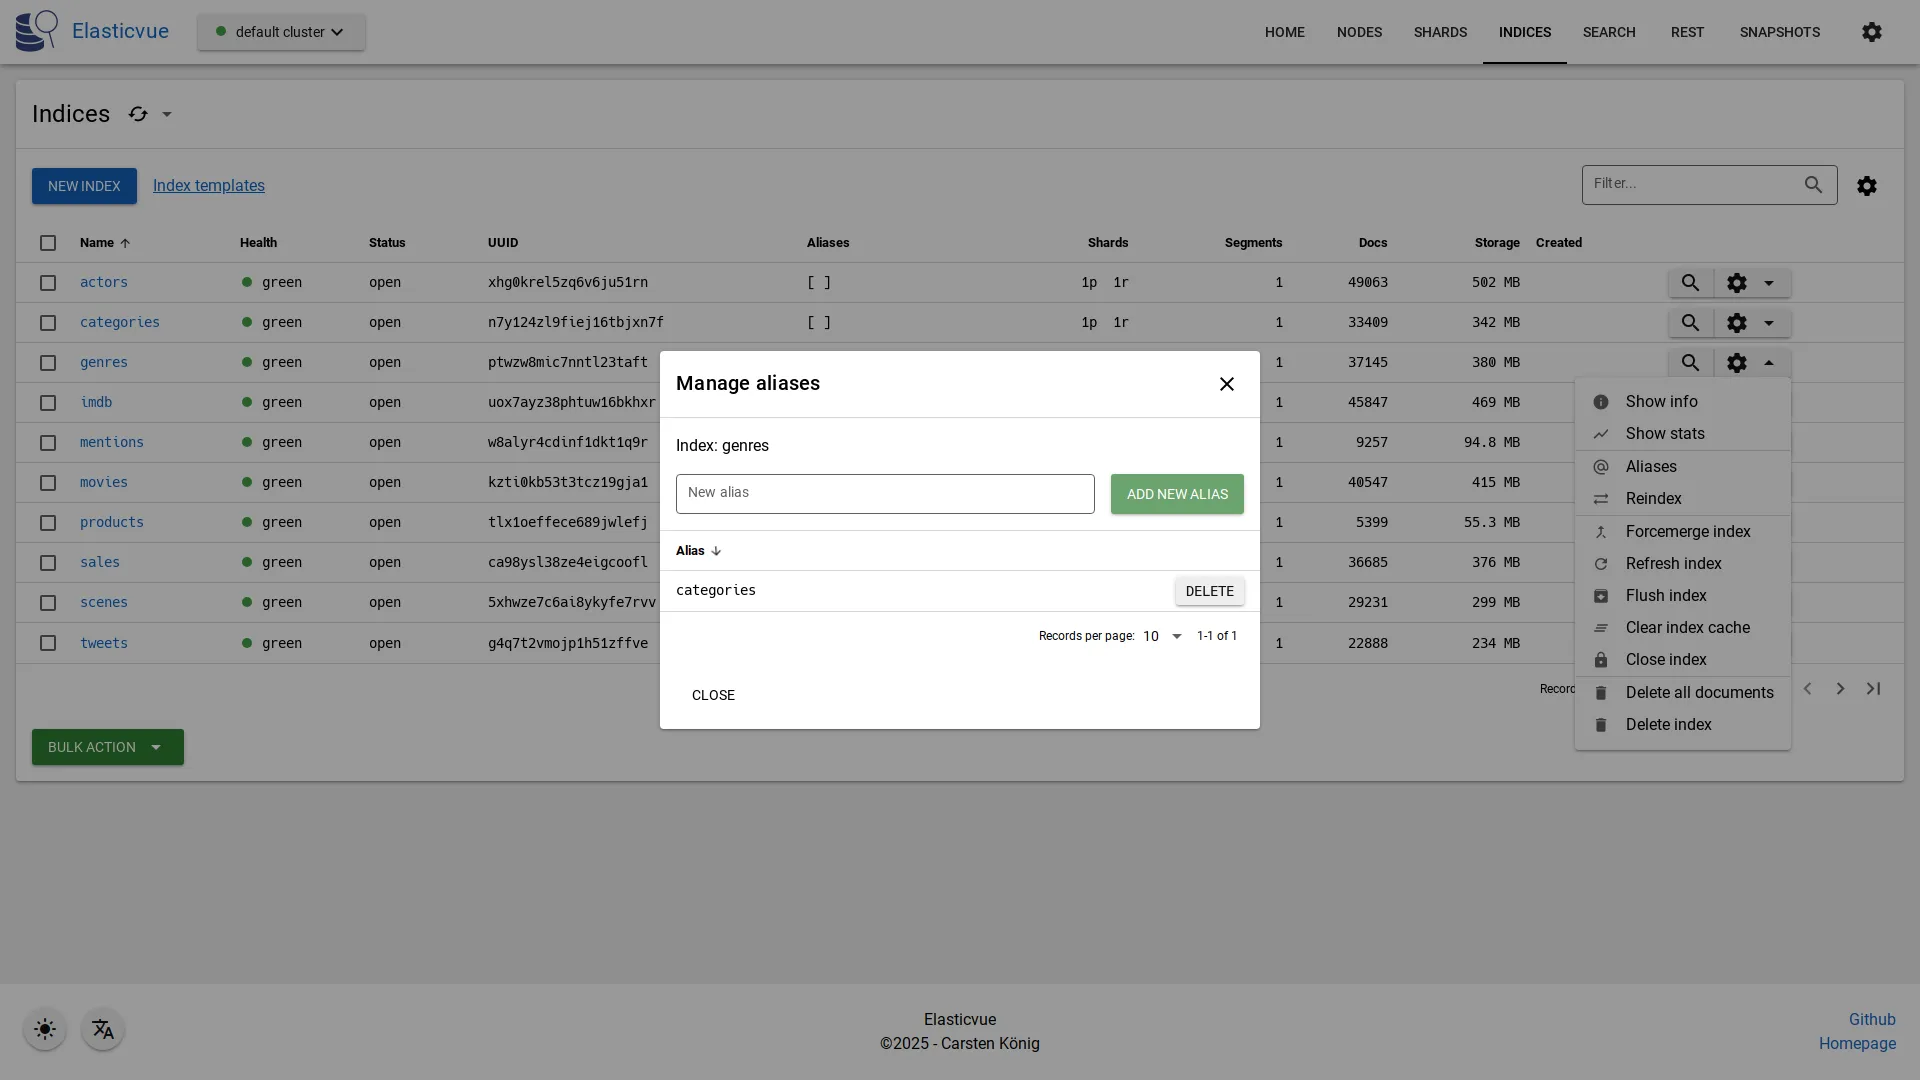
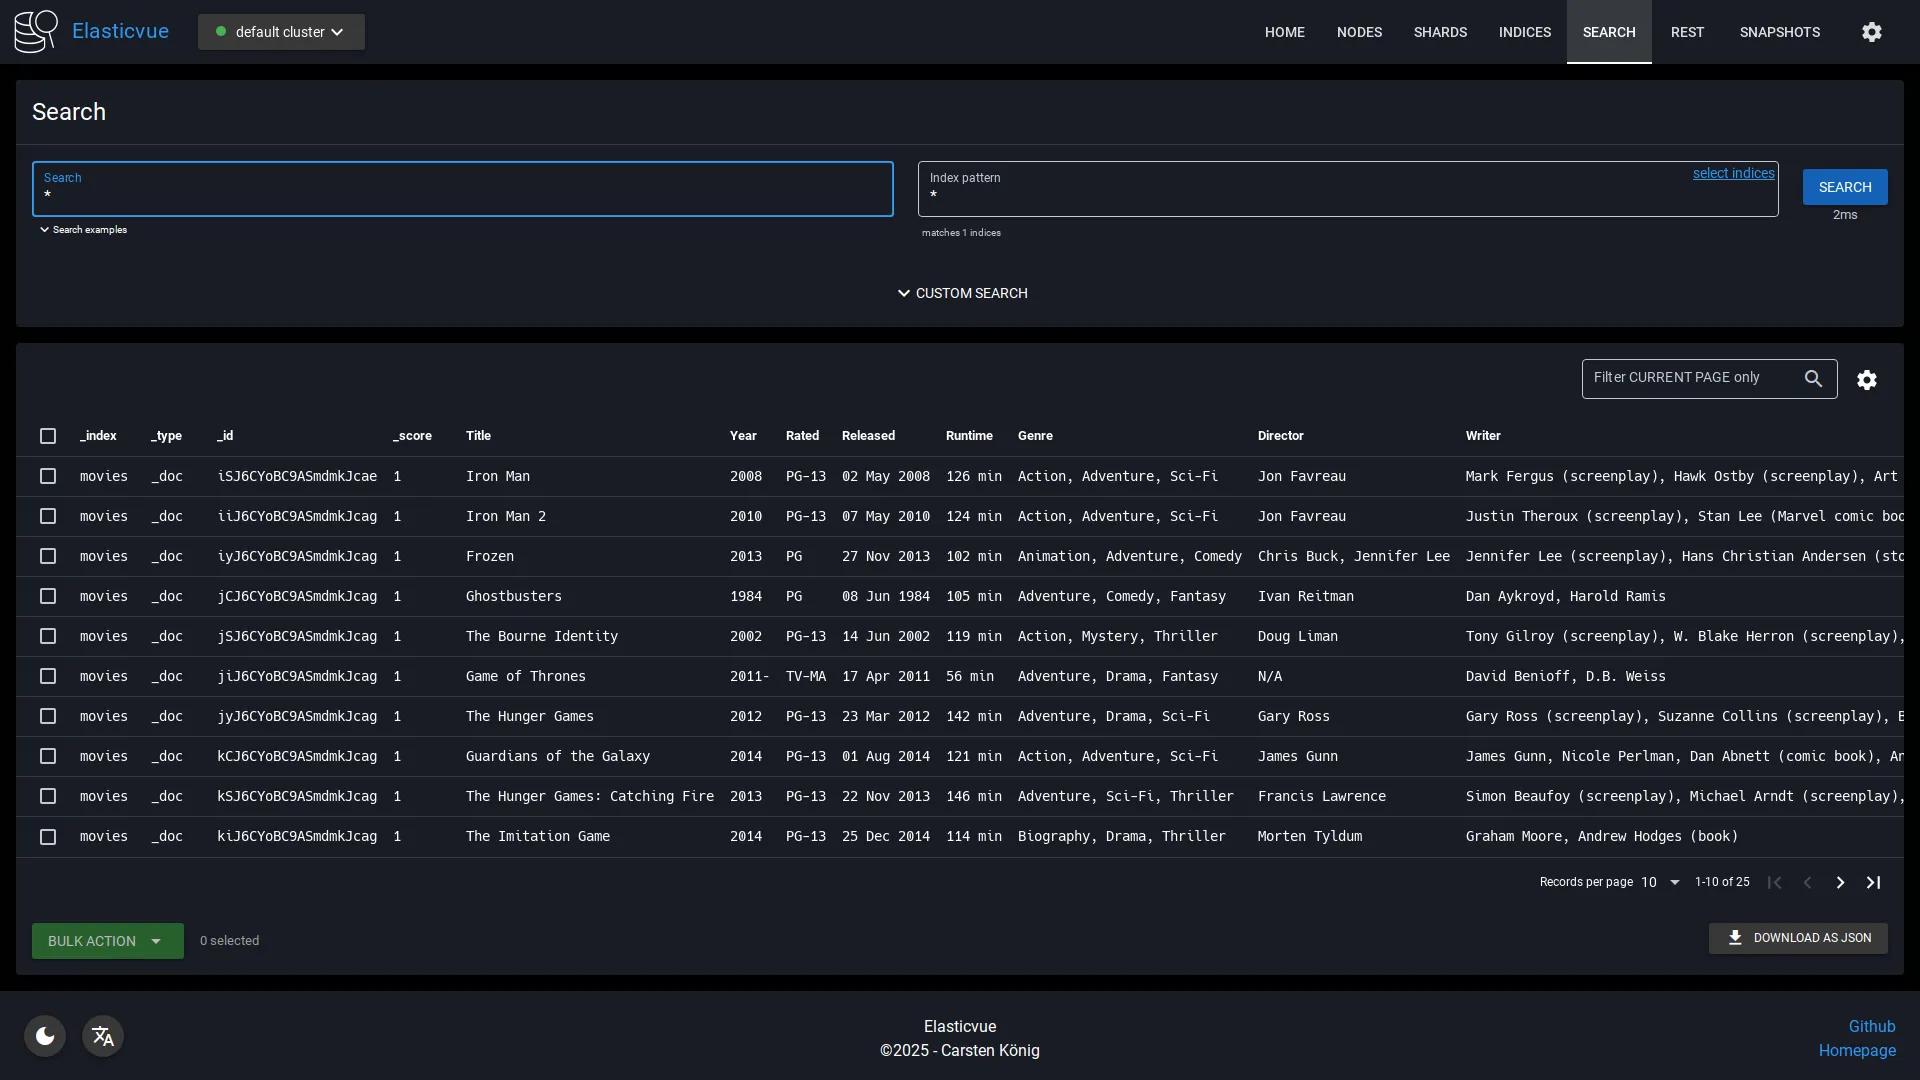
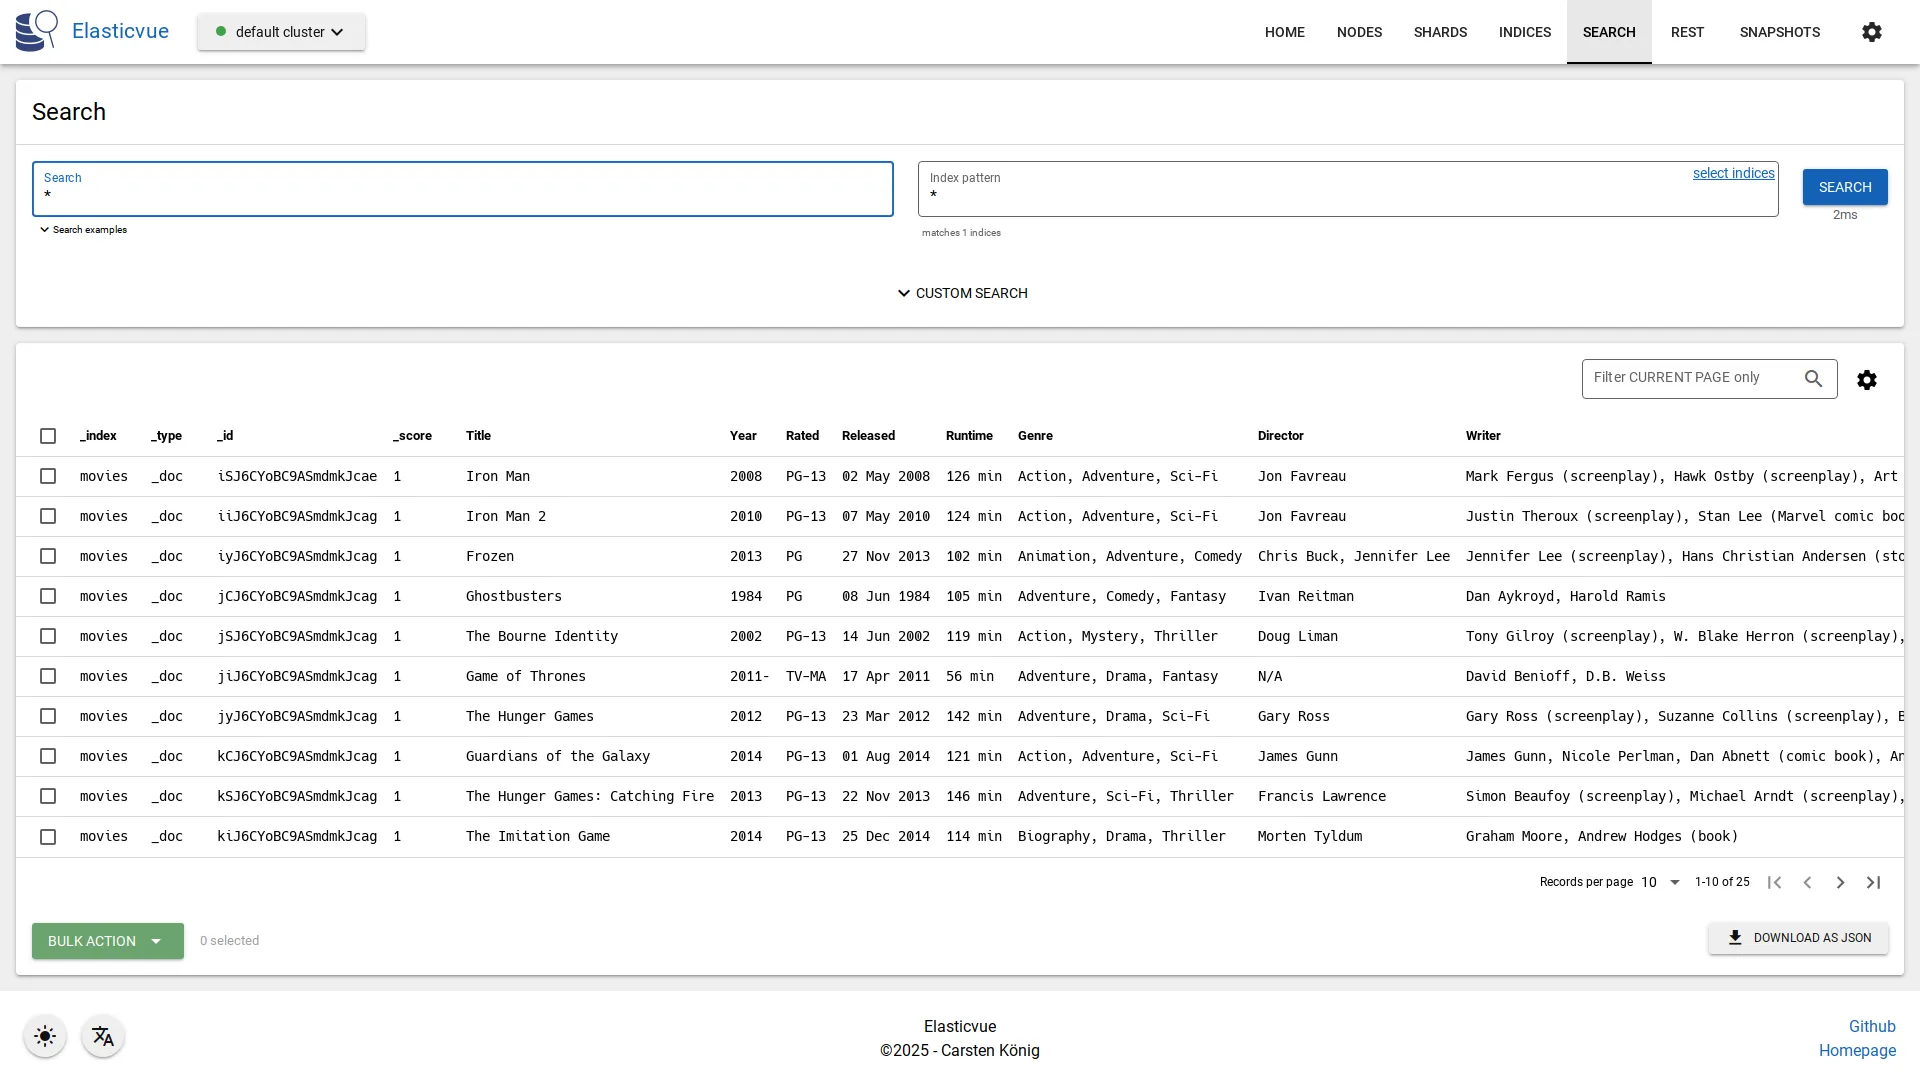
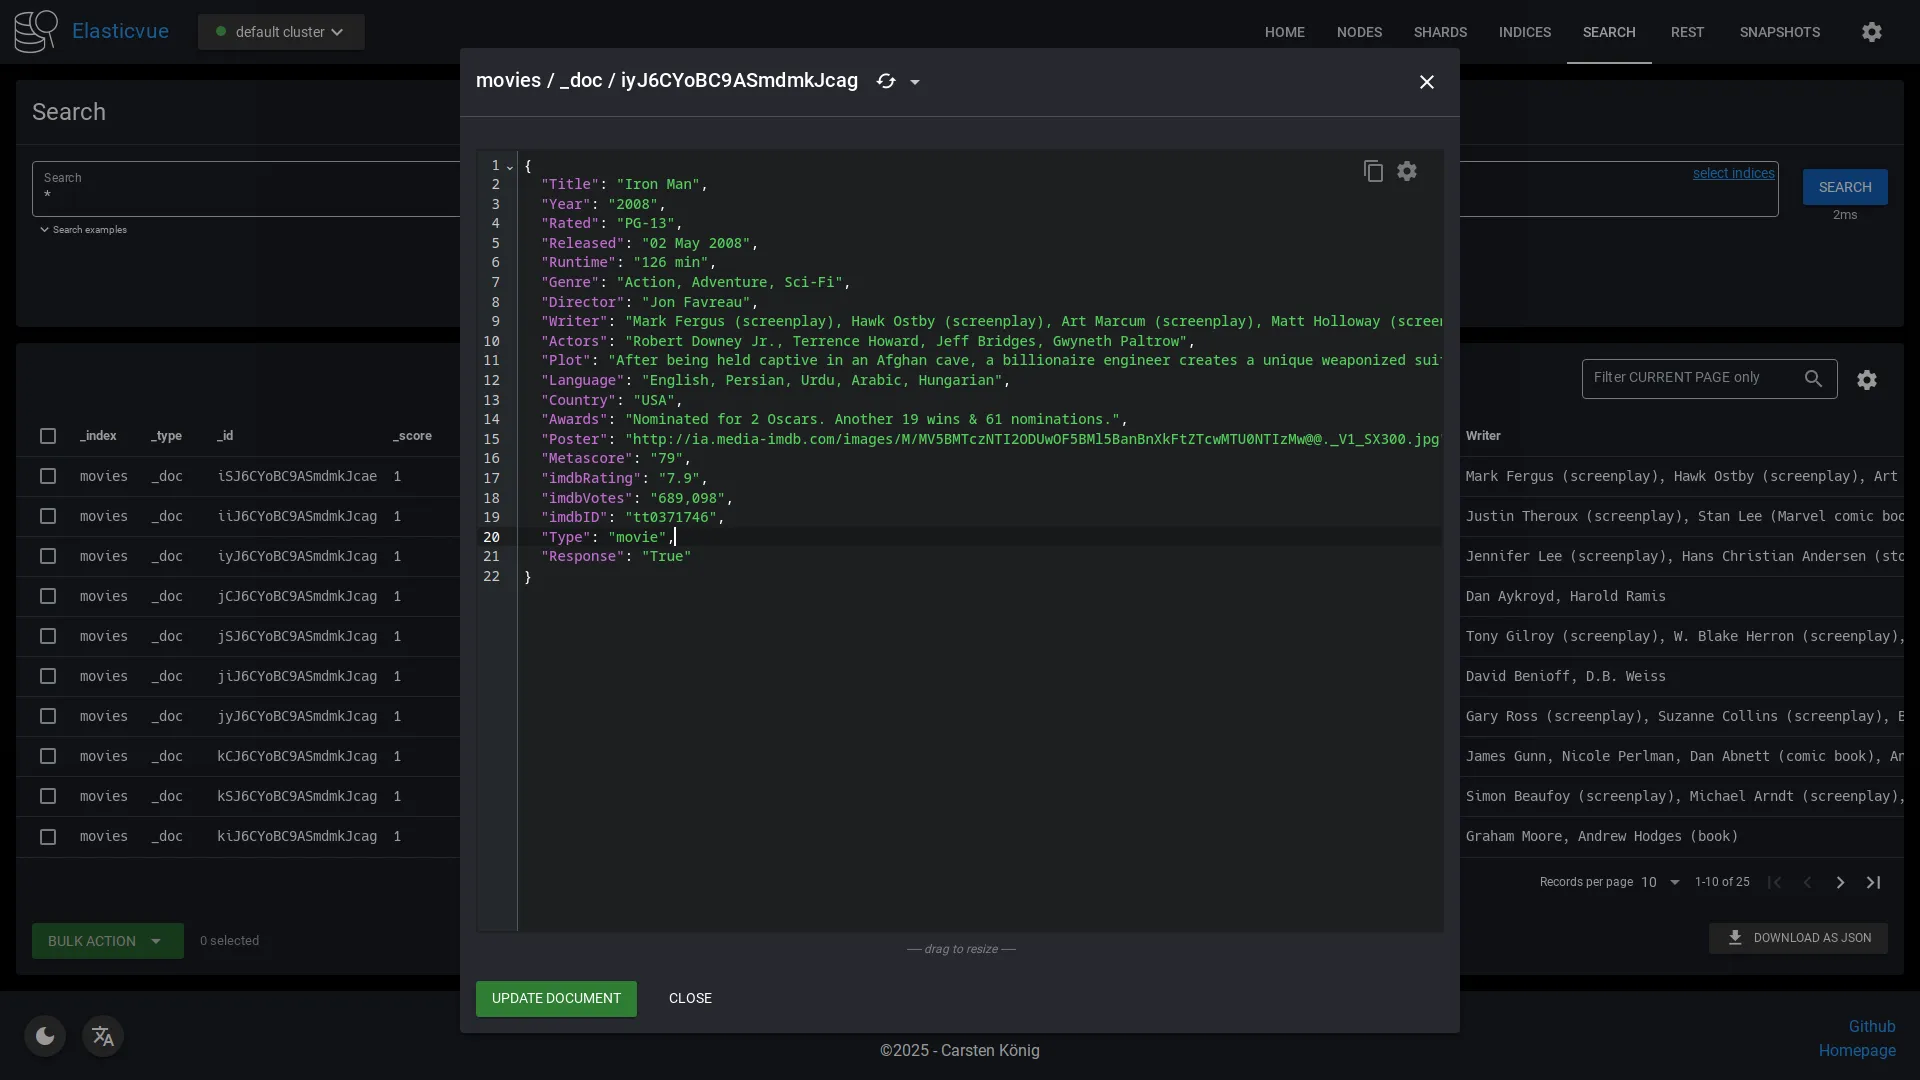
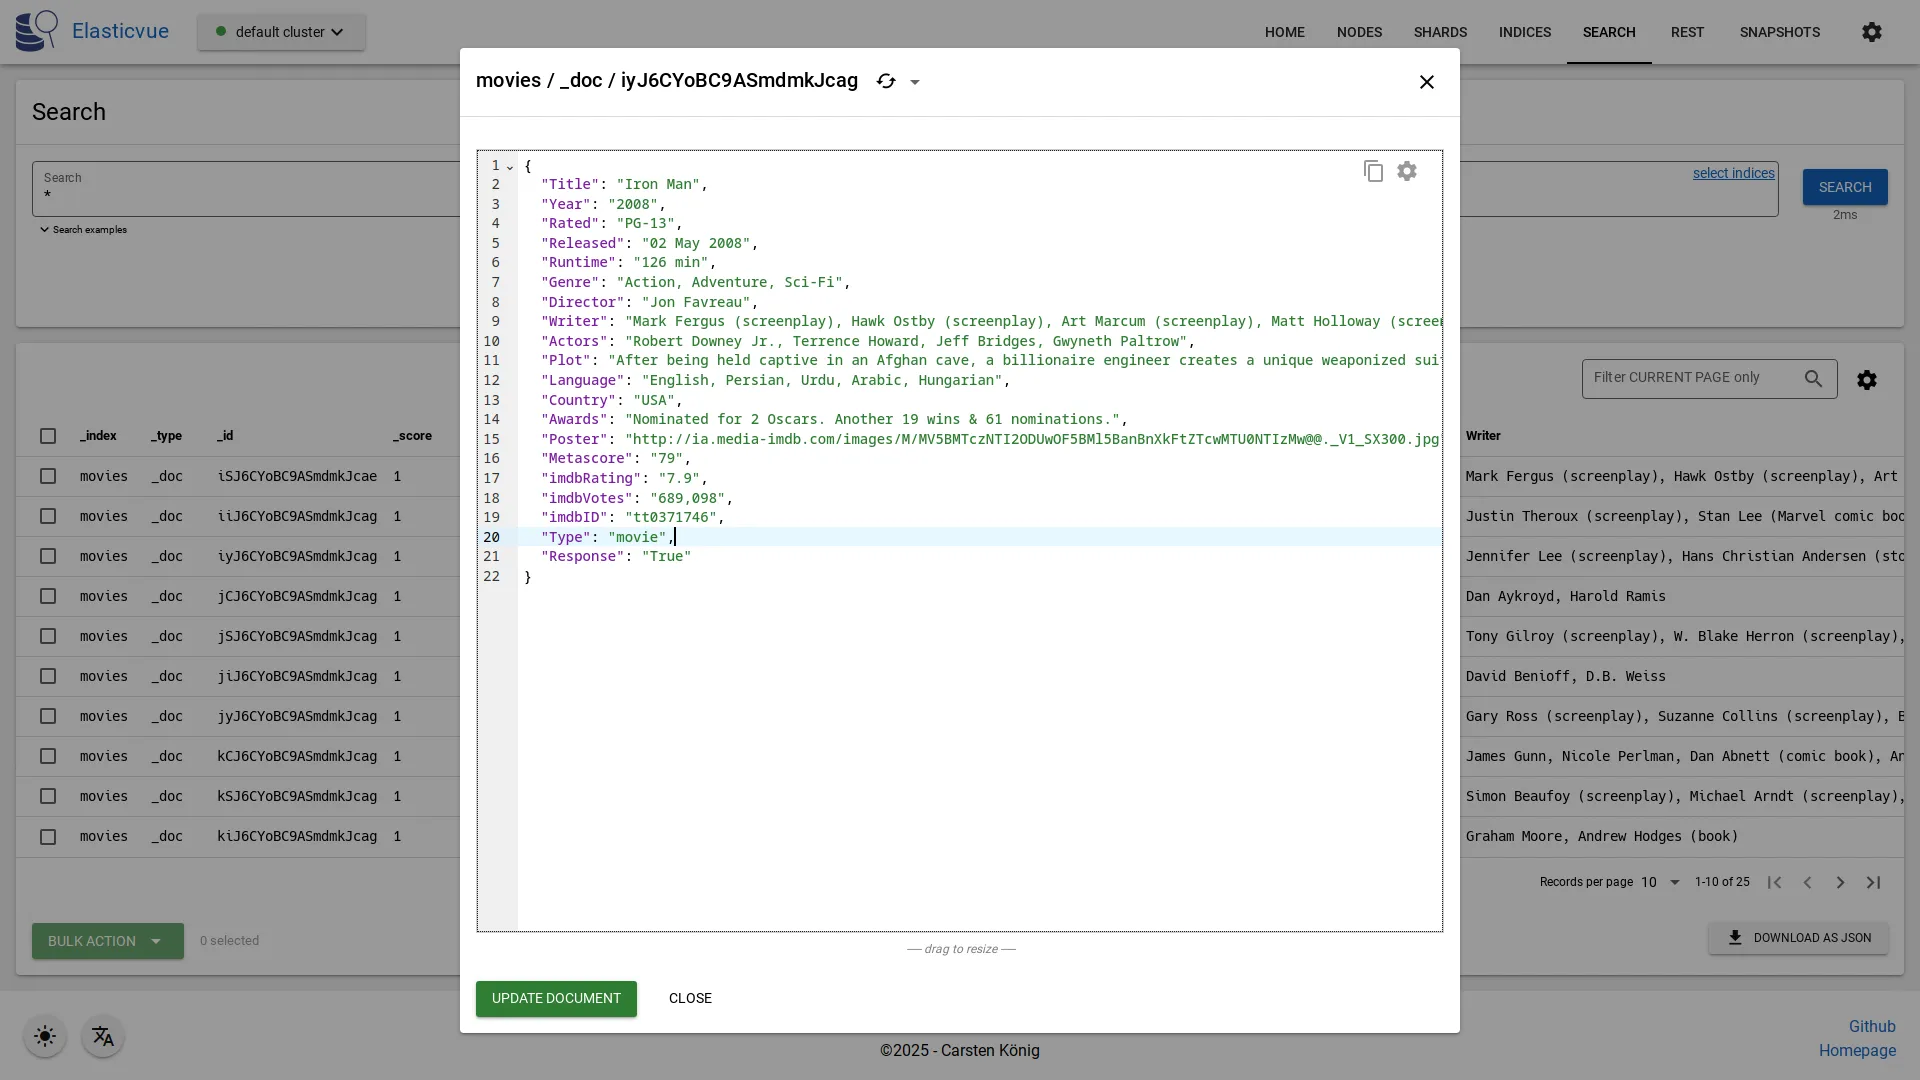
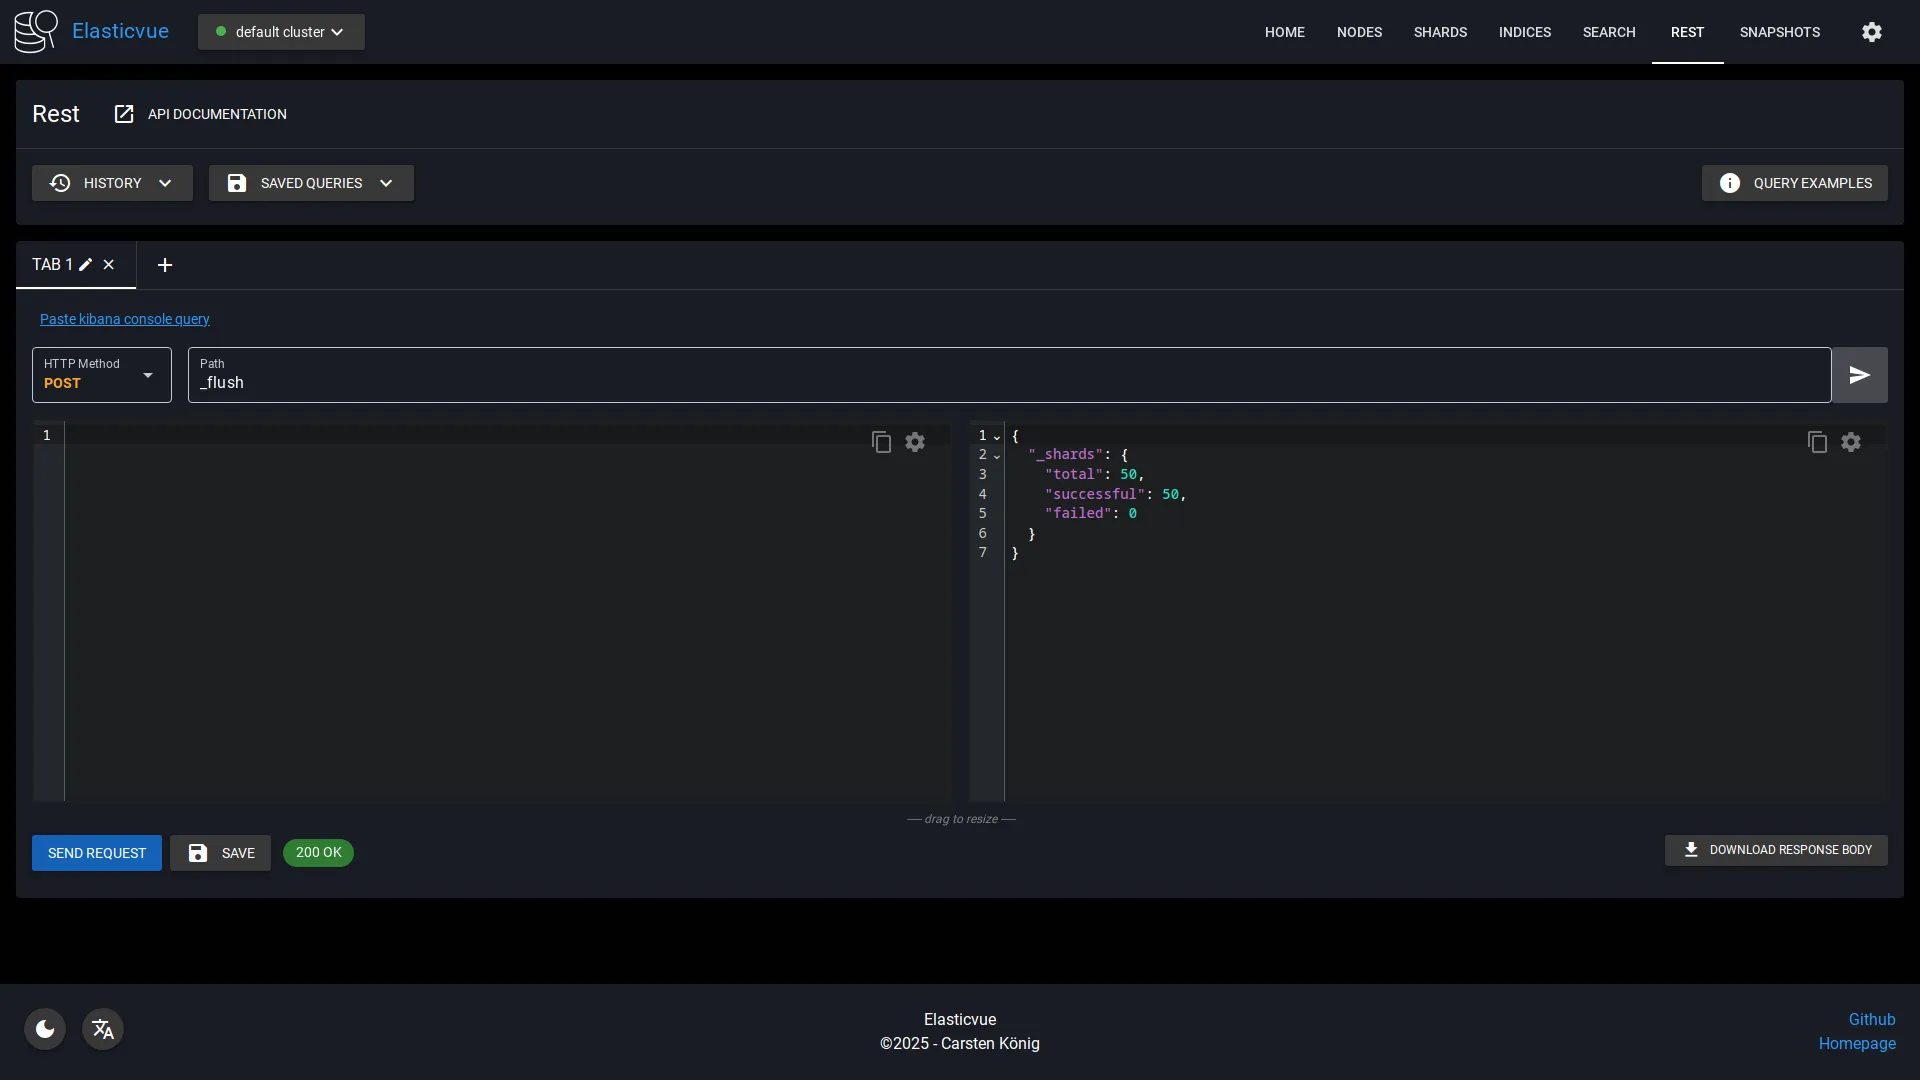
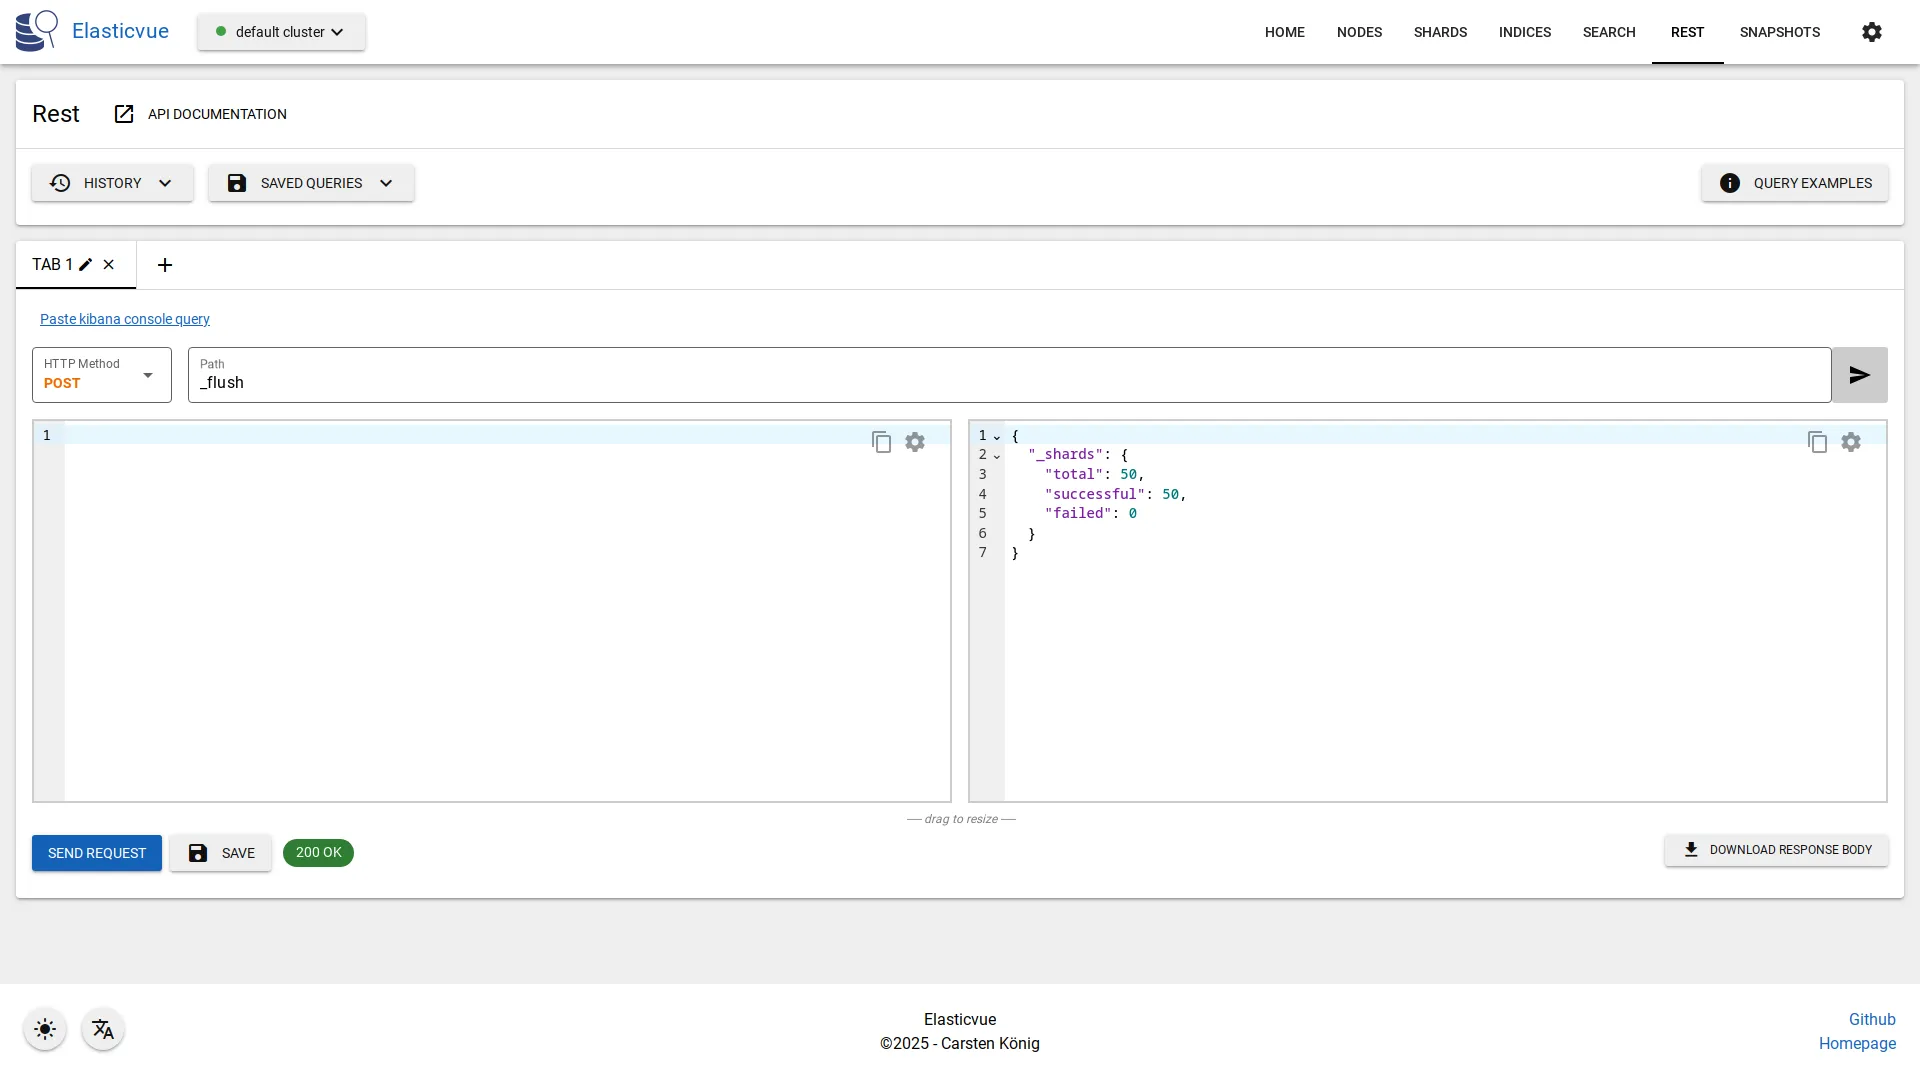
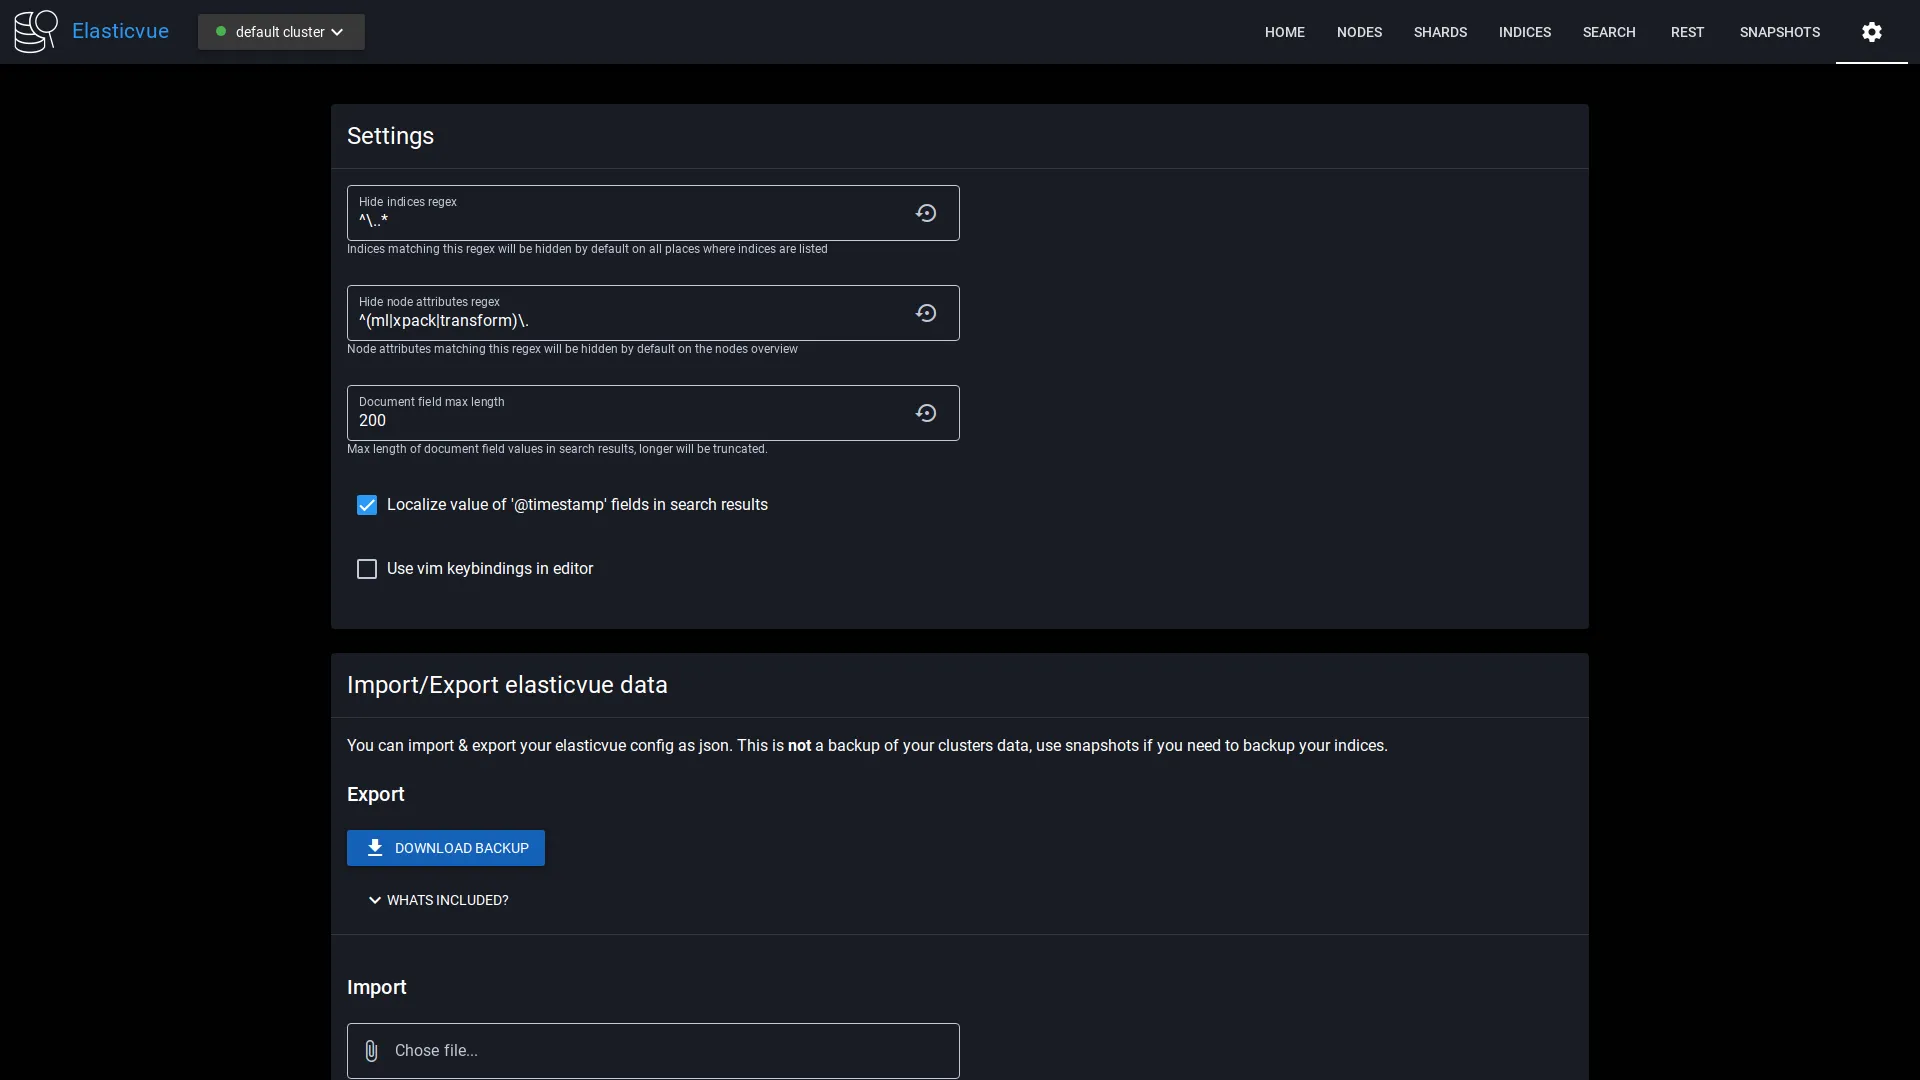
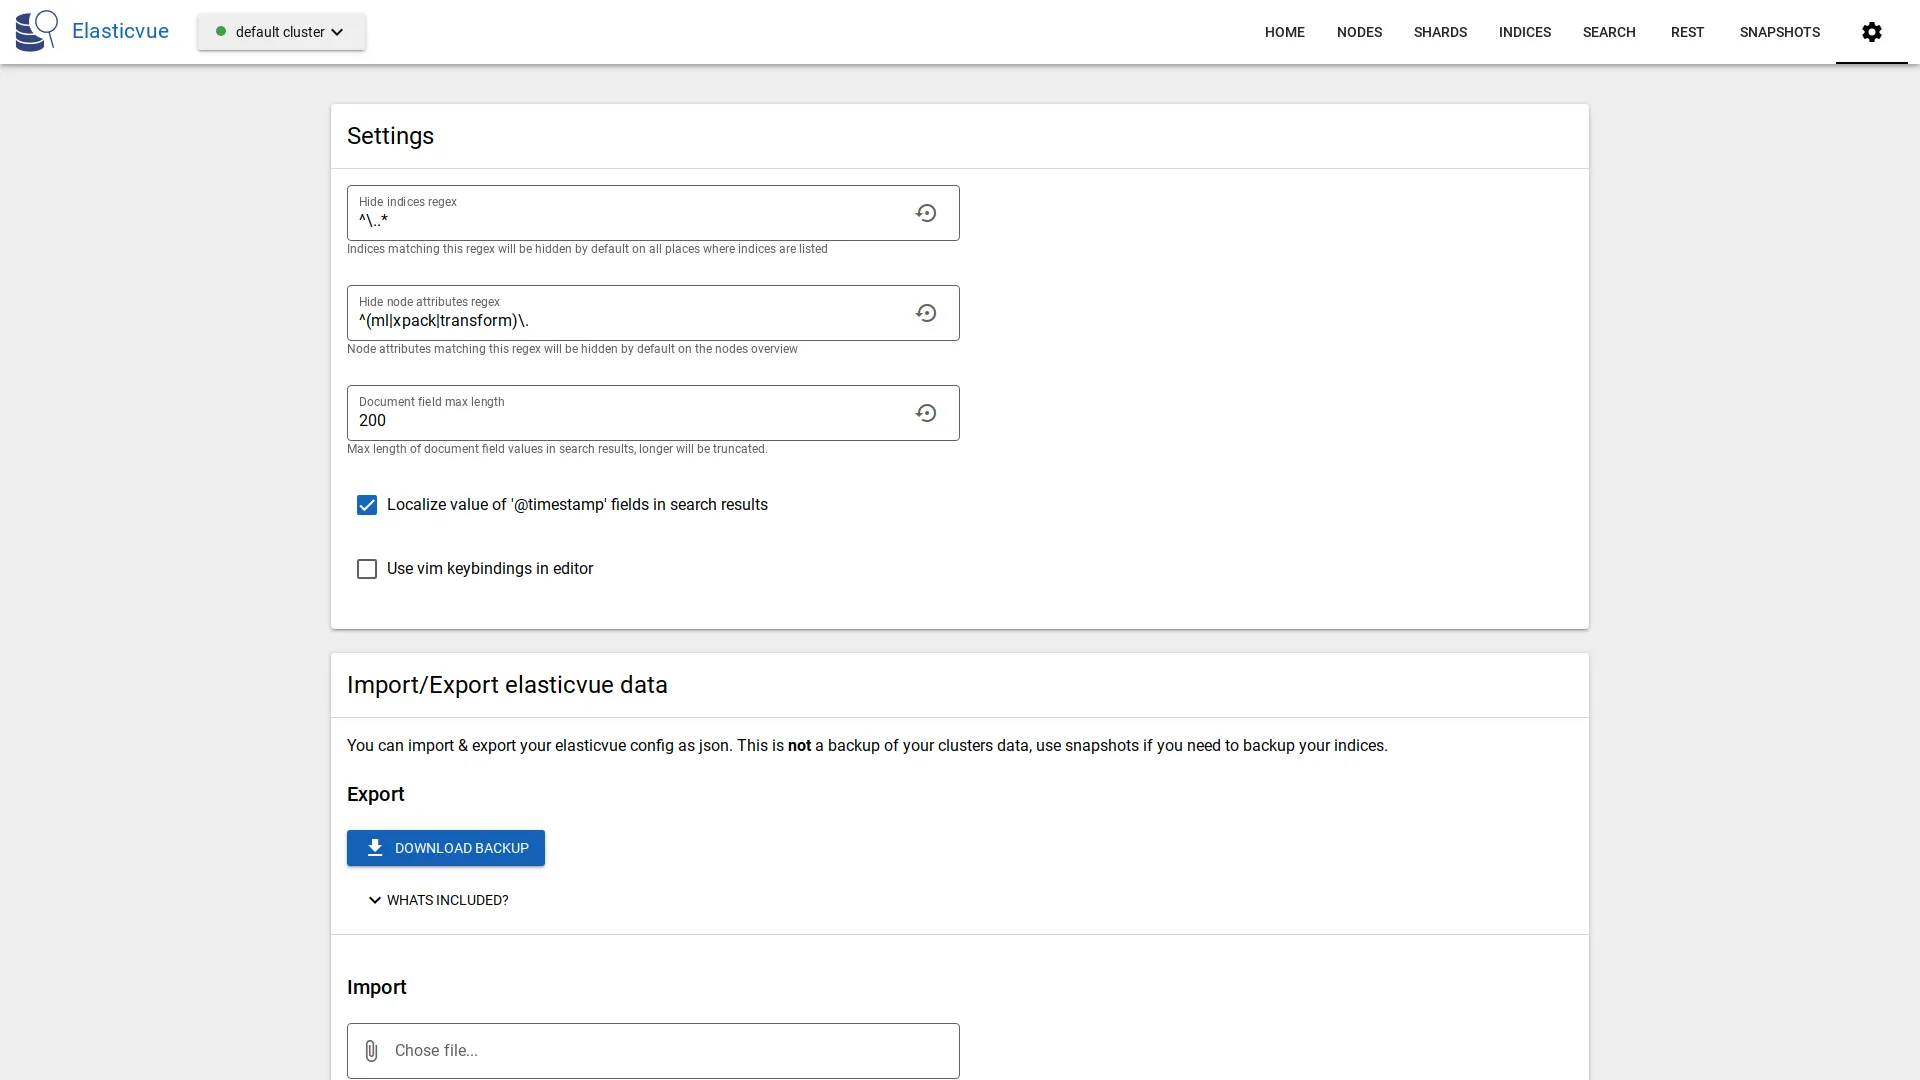
See elasticvue in action.
Elasticvue shows a summary of your clusters data. This includes the amount of nodes, shards, indices and the health of your whole cluster.
You can view a list of every node in your cluster.
The table shows the most important details about each node, including performance metrics like cpu and heap.
You can view your current shard allocations and also relocate shards to different nodes.
You can manually create and manage your indices. This includes viewing index settings and stats or opening and closing the index.
Elasticvue provides a frontend for you to quickly add & remove aliases for you indices.
You can search documents and view the results in a fully featured table, including sorting, filtering and pagination.
You can also adjust the generated query when you need additional control.
You can directly view and edit every document in your cluster.
Elasticvue has a gui to query your cluster via direct HTTP requests. You can also view and re-use your query history.
You can configure a custom regex to hide indices that you don' usually need.
You can also import & export your elasticvue data if you frequently switch devices or browsers.